Performance Snapshot
Key Metrics at a Glance
Overall Churn Rate
26.54%
1,869 of 7,043 customers
Monthly Revenue Lost
£139,131
from churned customers
Annualised Revenue at Risk
£1.67M
30.50% of total revenue
Month-to-Month Churn
42.71%
vs. 2.8% two-year contracts
High-Risk Customers
814
M2M · >£70/mo · <12mo tenure
High-Risk Churn Rate
69.53%
3.3× the standard base rate
Executive Dashboards
Four Dashboards, One Business Story
Built in Excel using structured tables, KPI cards, and cross-sheet referencing — SQL performs all computation, Excel presents the business insight. Each dashboard moves the reader from "what is happening?" to "where should the business act?"
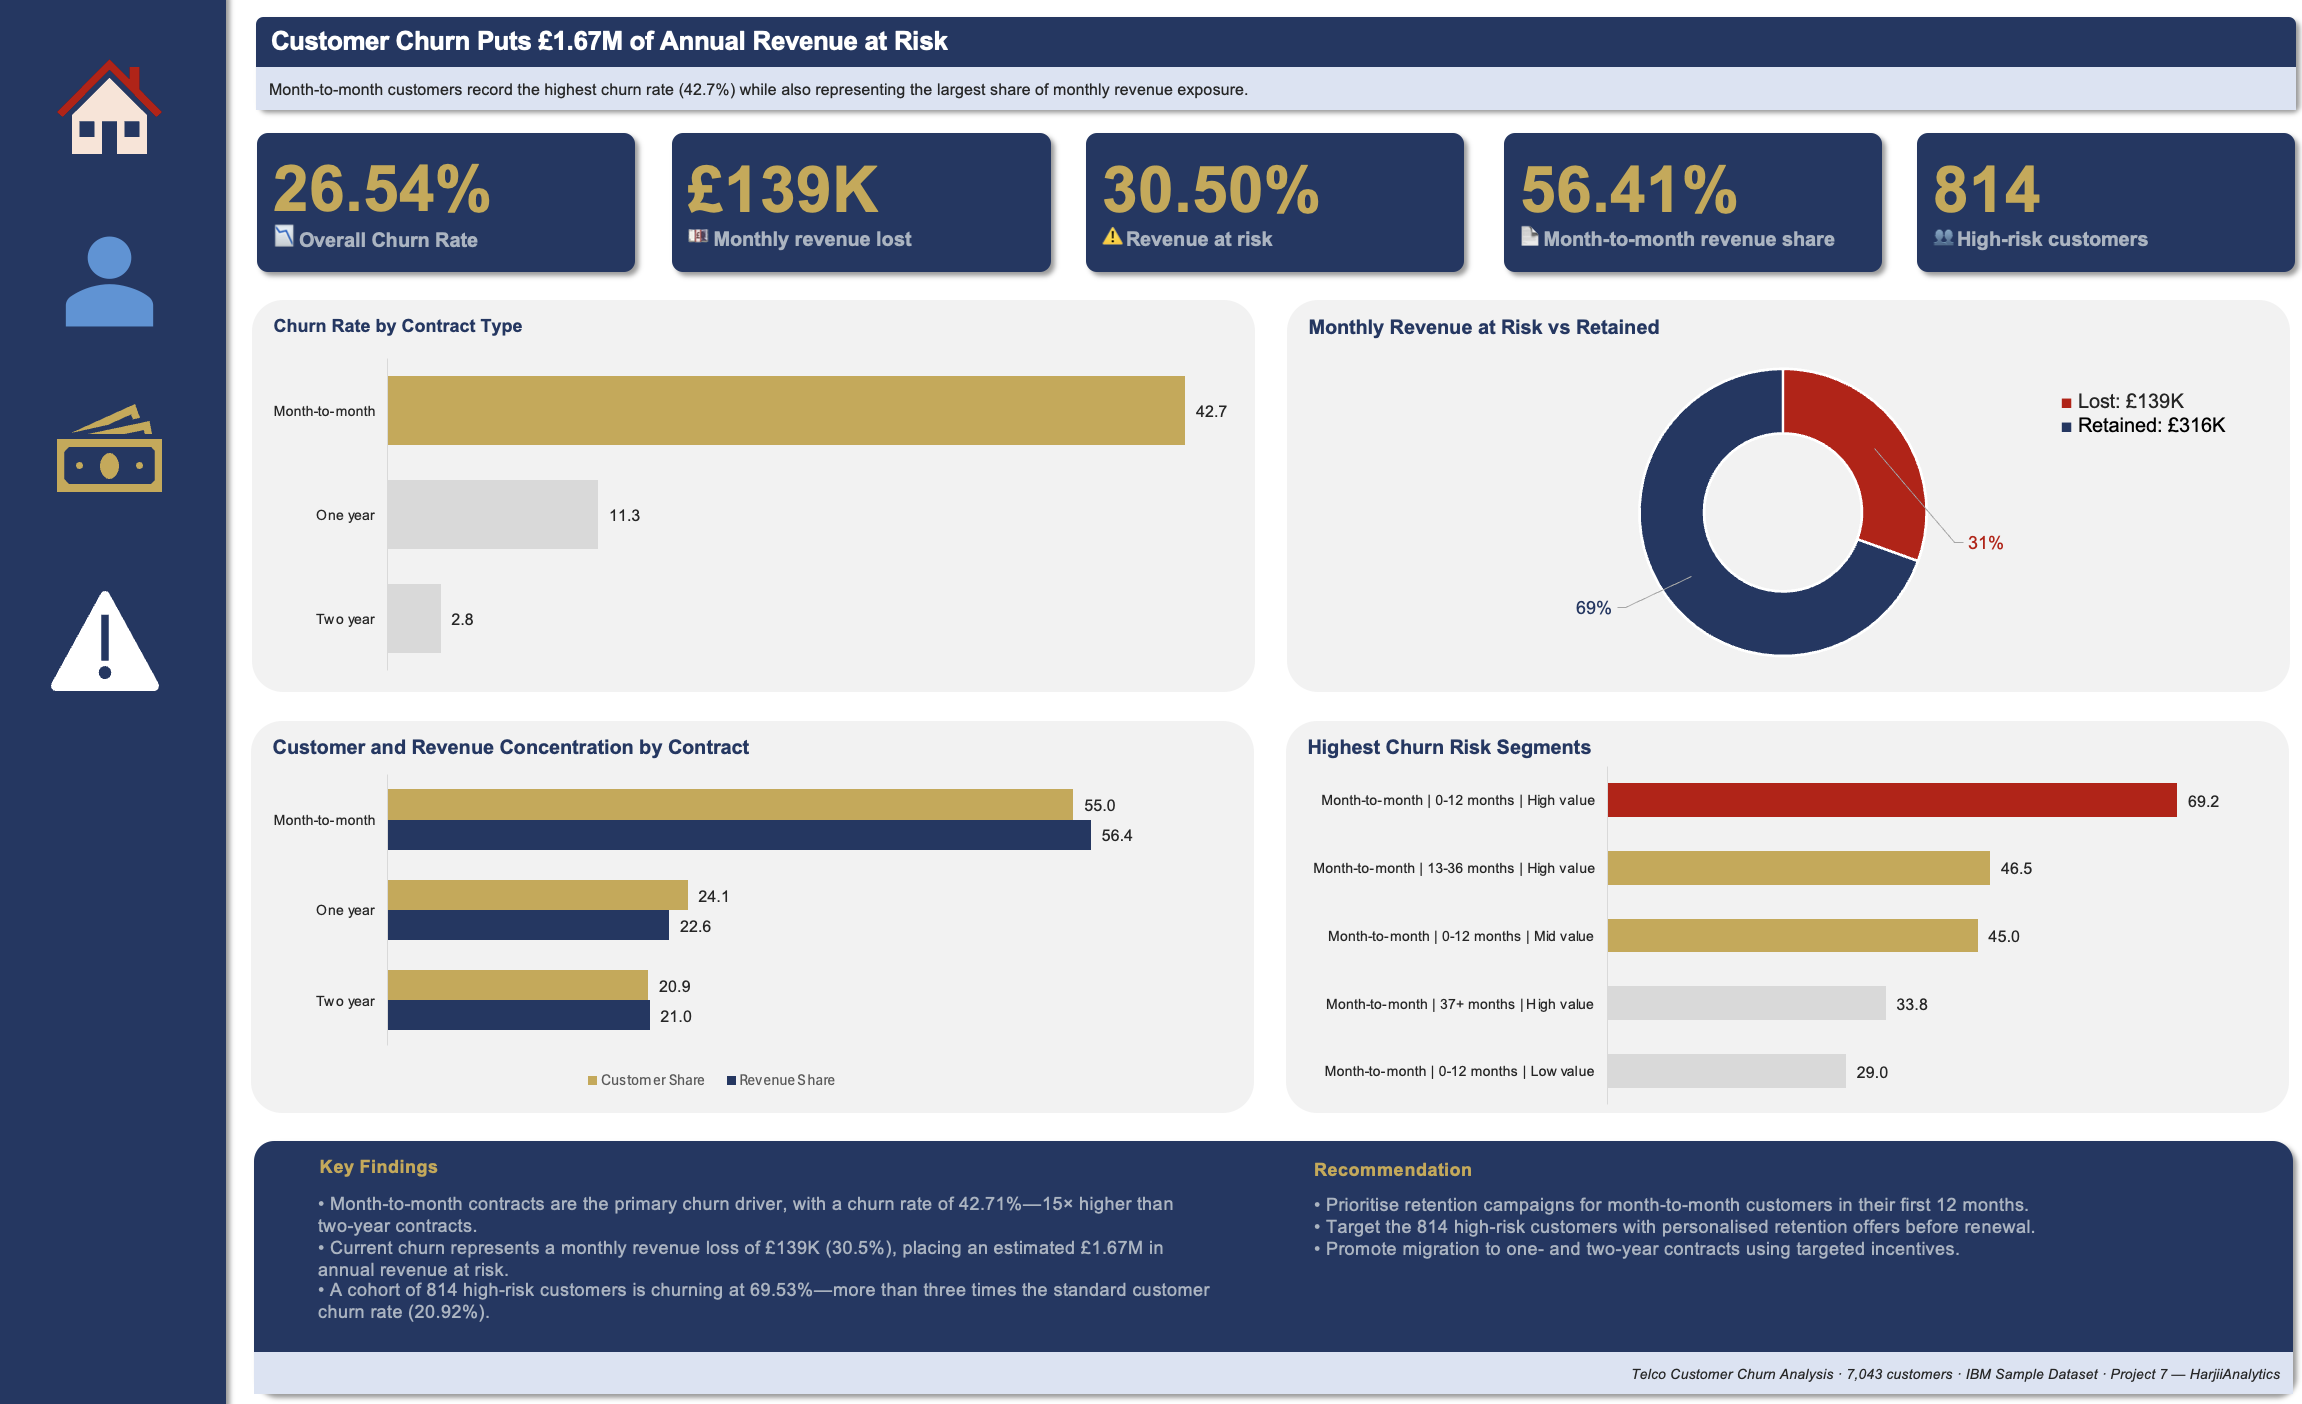
01 — Executive Summary: churn, revenue at risk, and top-line risk indicators in one view
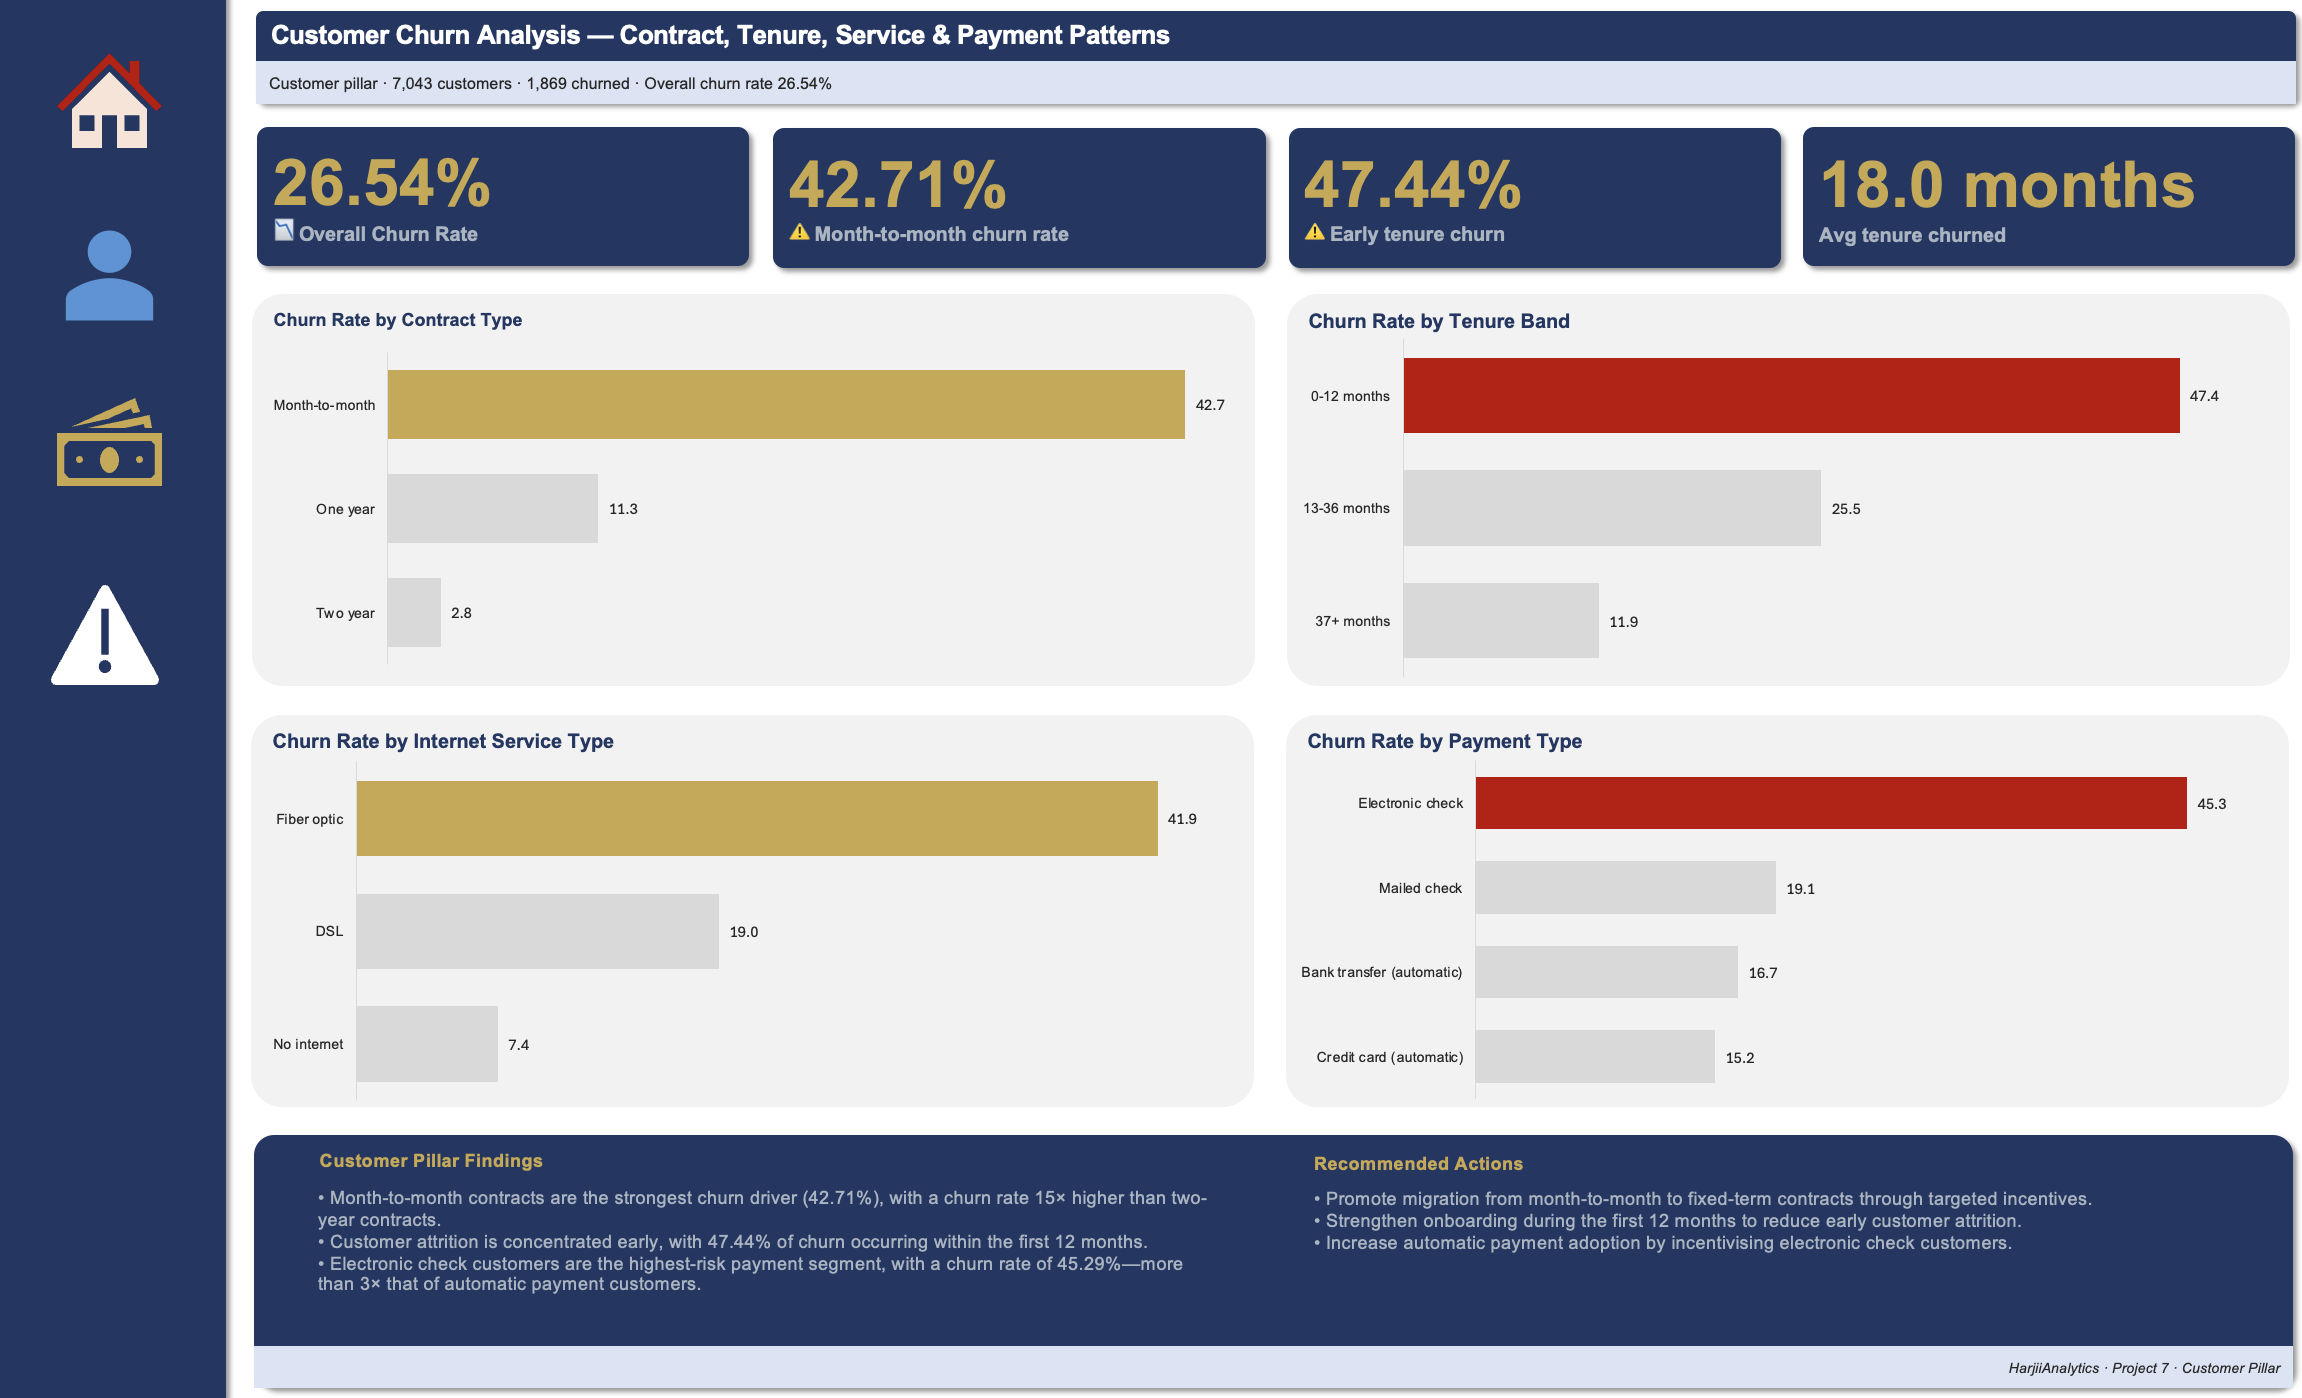
02 — Customer: churn by contract, tenure, internet service, and payment method
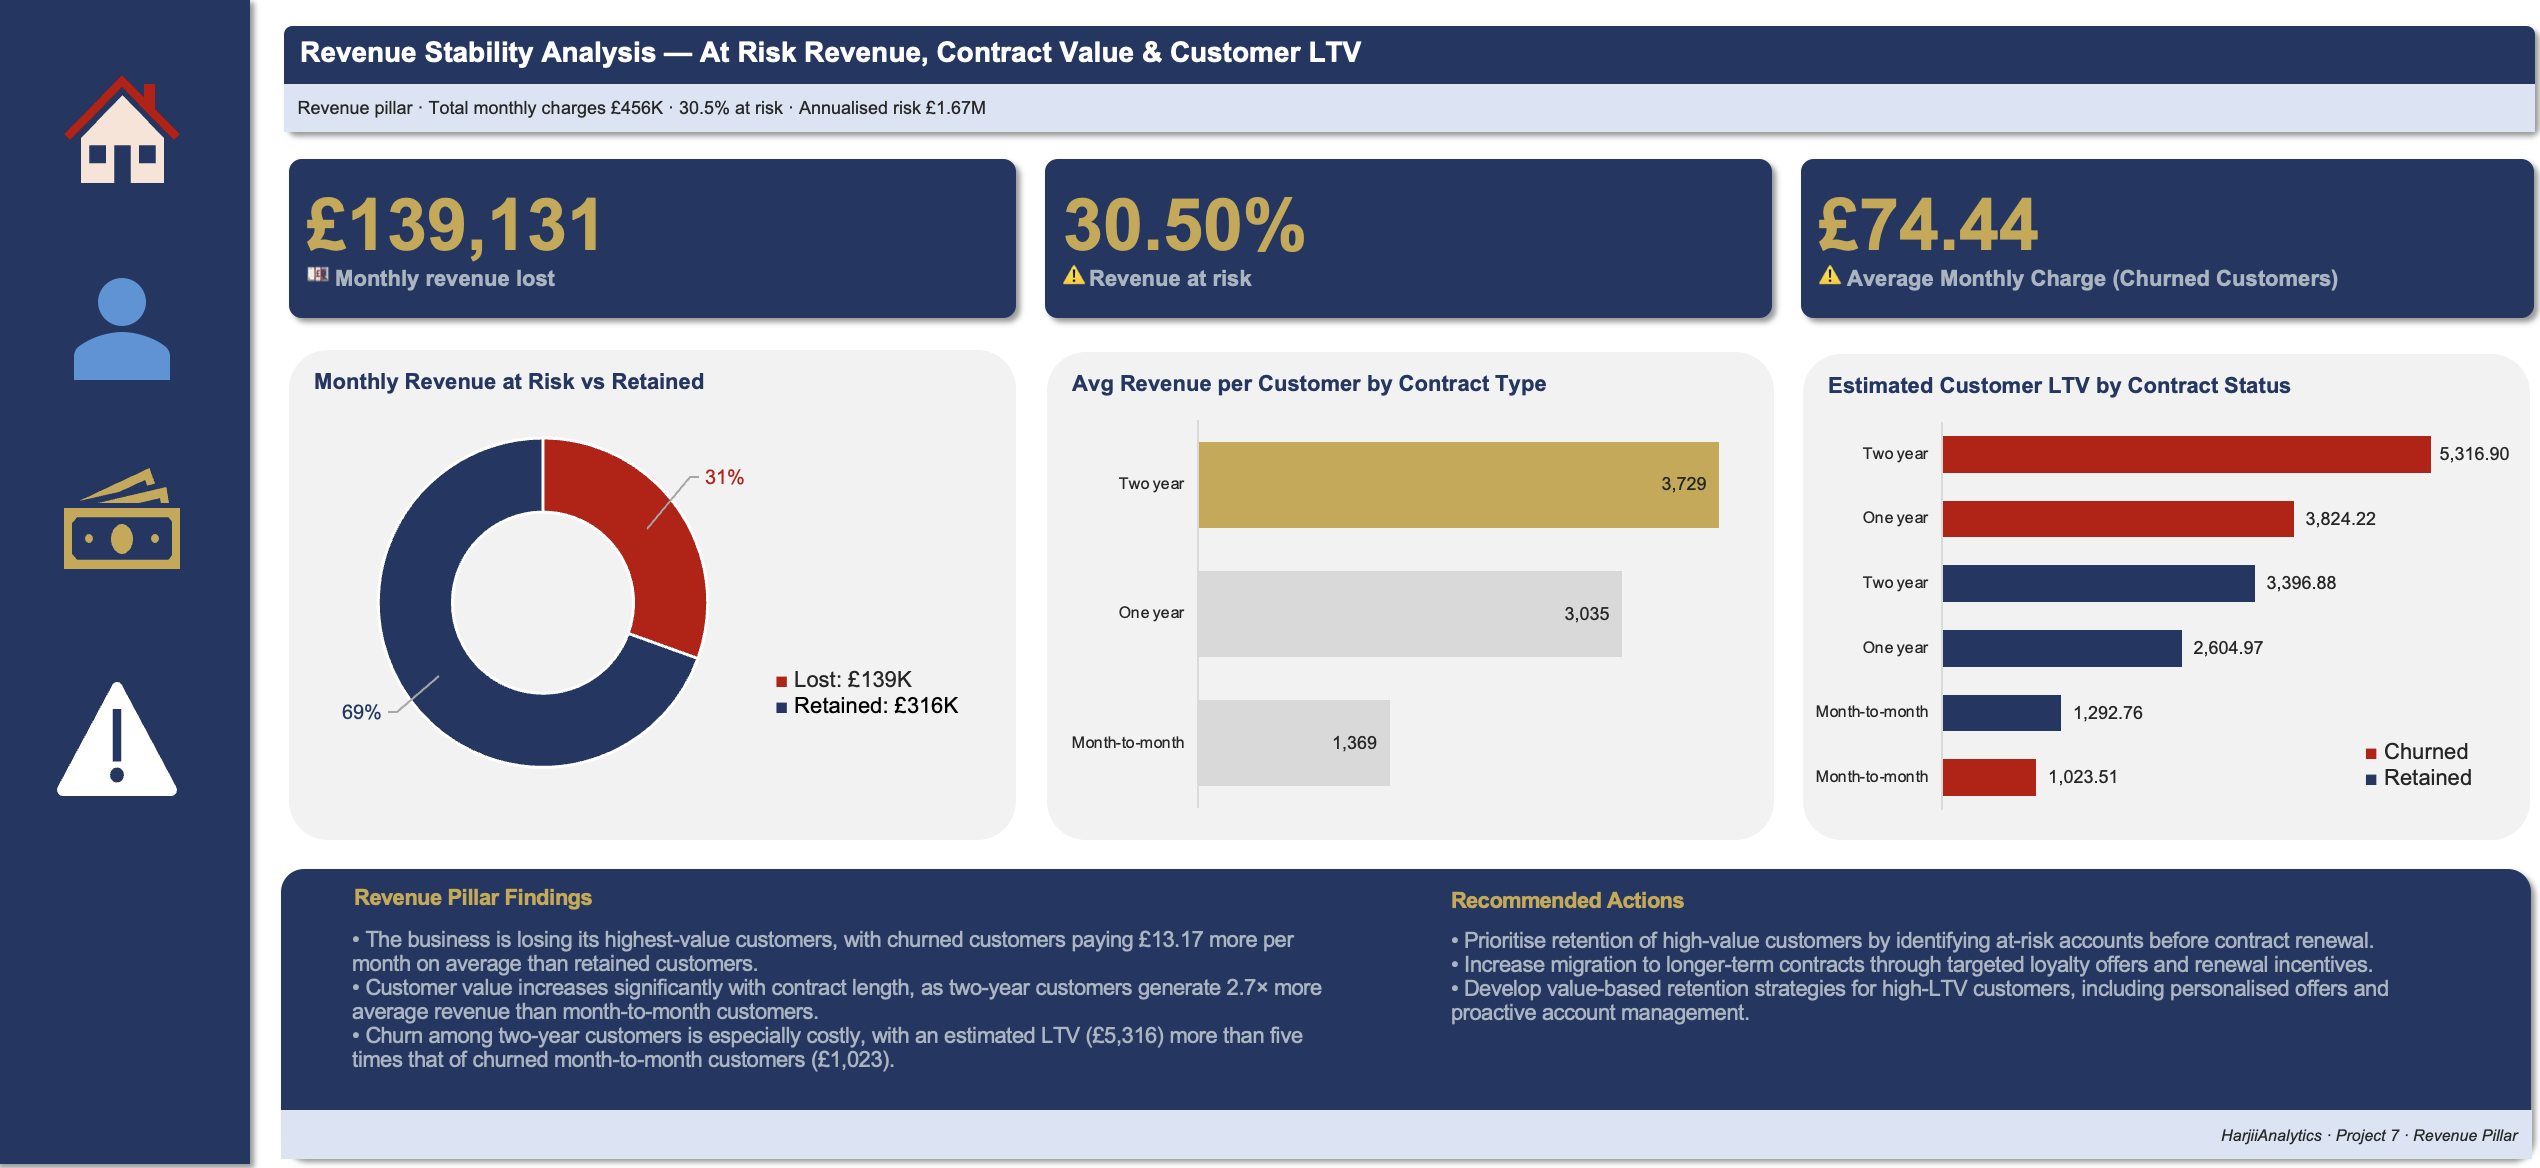
03 — Revenue: revenue at risk, customer value, and estimated lifetime value by segment
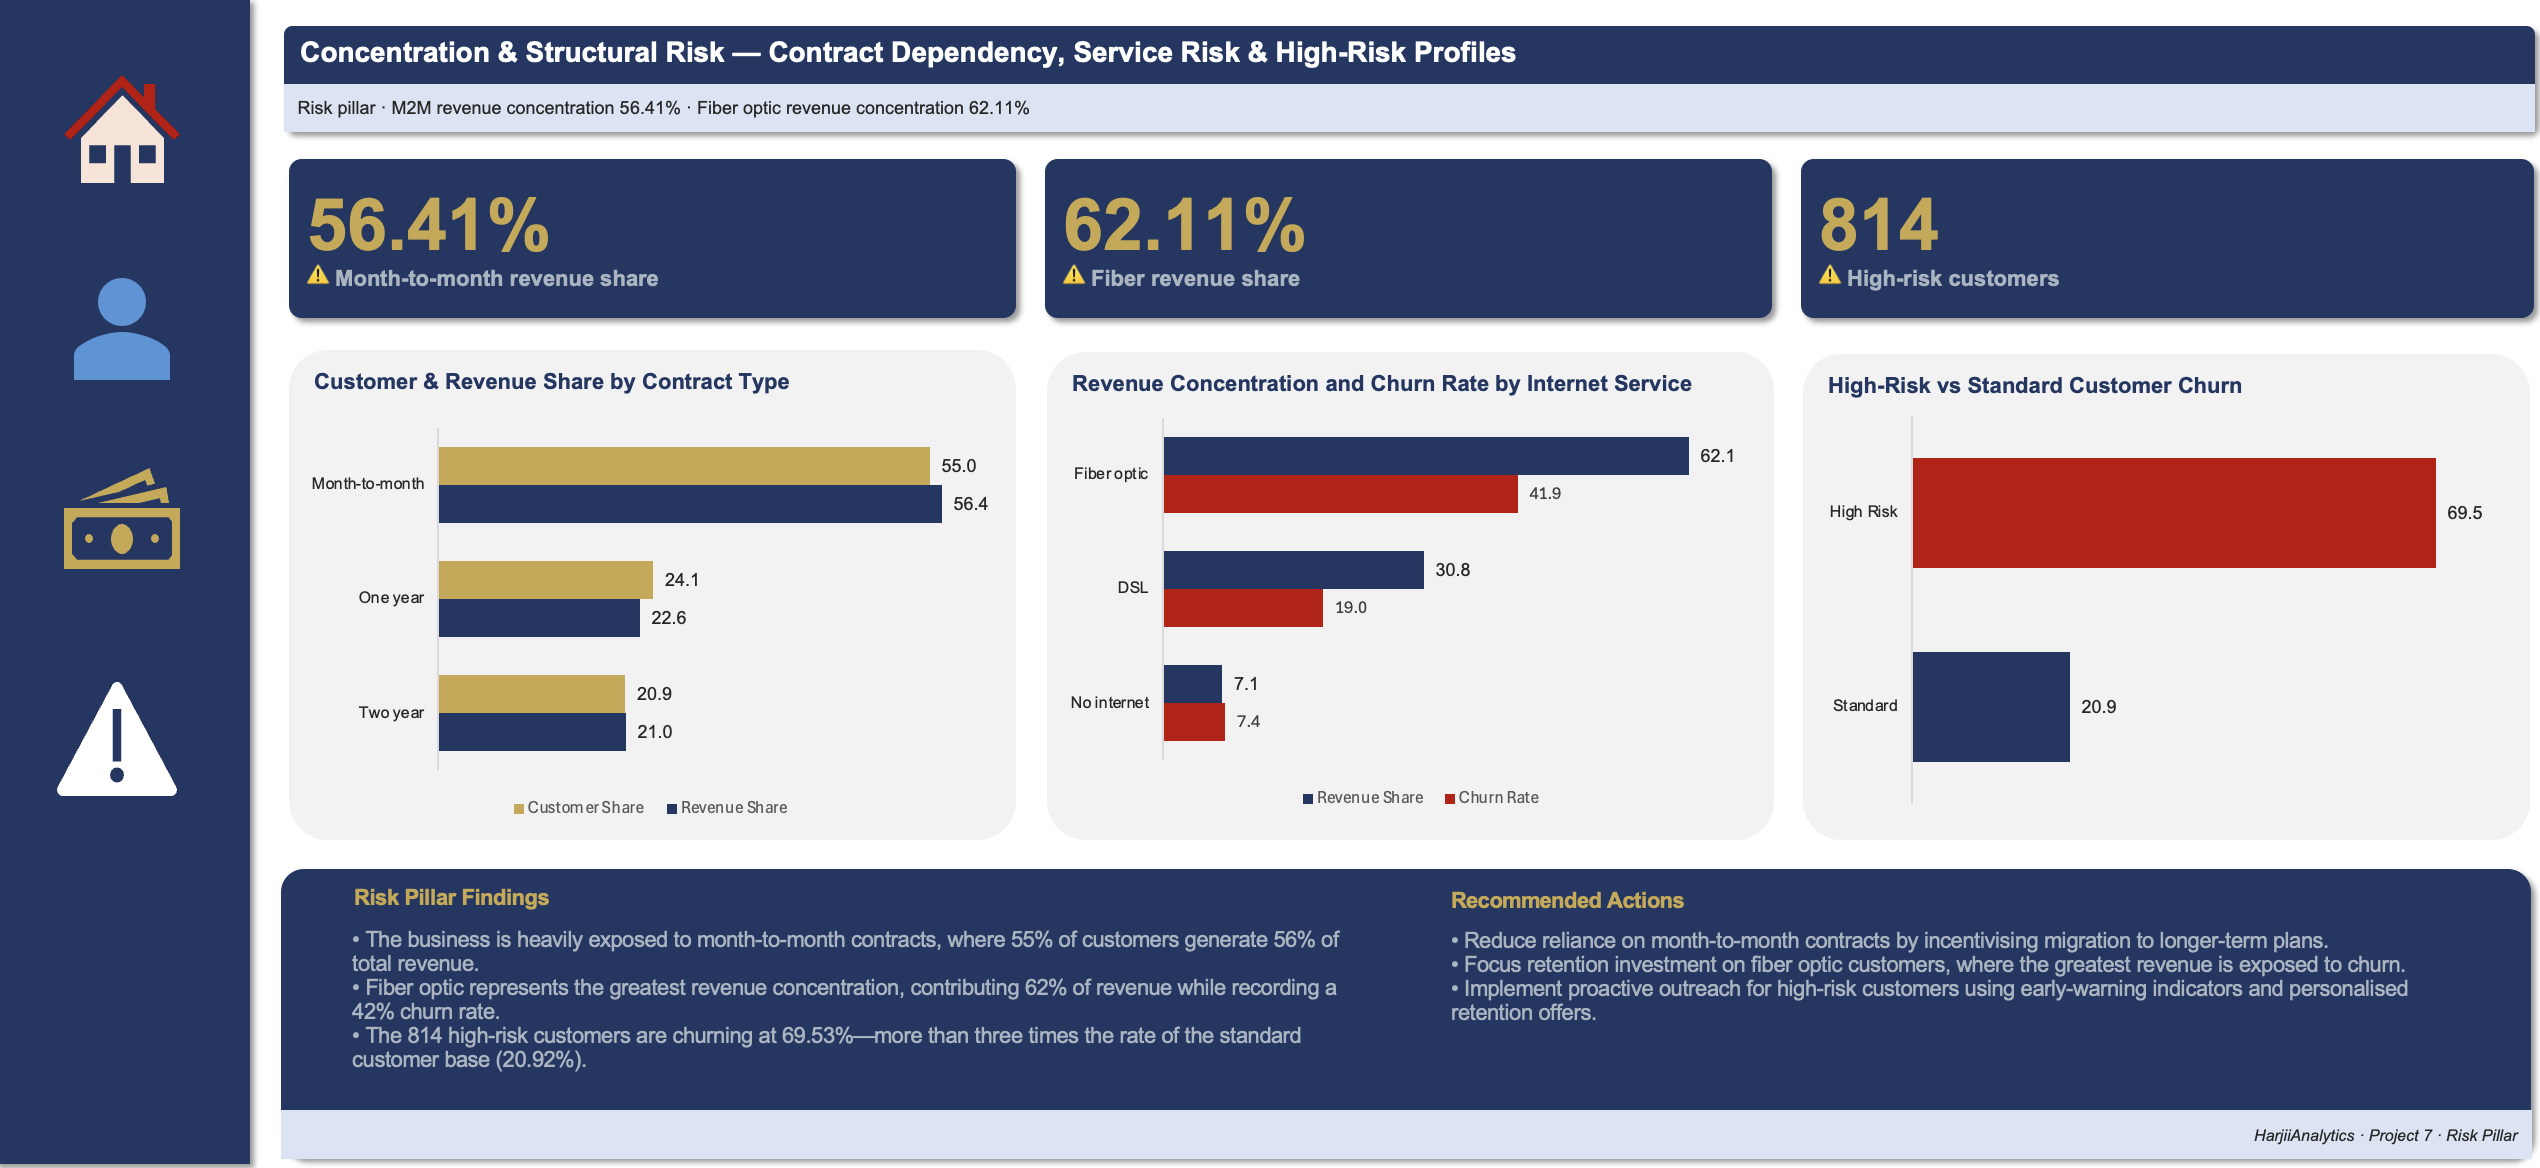
04 — Risk: contract dependency, service concentration, and high-risk customer profiling
Customer Pillar
Who Is Churning, and Why
Contract Type
Month-to-Month Contracts Drive Churn — 15× Higher Than Two-Year
Month-to-month customers churn at 42.71%, compared to 11.3% for one-year and just 2.8% for two-year contracts. Contract flexibility is the single strongest churn signal in the dataset.
01
Tenure
Nearly Half of Churn Happens in the First 12 Months
Customers with 0–12 months tenure churn at 47.44%, dropping to 25.5% at 13–36 months and 11.9% beyond 37 months. Early onboarding is the highest-leverage retention window.
02
Internet Service
Fiber Optic Customers Churn at 41.89% Despite Driving Most Revenue
Fiber optic churn (41.89%) is more than double DSL (19.0%) and far above no-internet customers (7.4%) — a service-specific retention challenge tied to the business's largest revenue source.
03
Payment Method
Electronic Check Is the Highest-Risk Payment Method
Electronic check customers churn at 45.29% — more than 3× the churn rate of automatic payment methods (bank transfer 16.7%, credit card 15.2%), making payment type an early behavioural churn signal.
04
Revenue Pillar
What Financial Value Is Being Lost
Revenue Exposure
30.50% of Monthly Revenue Is Tied to Churning Customers
Churn puts £139,131 in monthly revenue — £1.67M annualised — at risk. Nearly one-third of recurring revenue is associated with customers who ultimately leave.
05
Customer Value
The Business Is Losing Its Highest-Value Customers
Churned customers pay £74.44/month on average versus £61.27 for retained customers — roughly £13 more per month walking out the door with every churned account.
06
Contract Value
Two-Year Contracts Generate 2.7× More Revenue per Customer
Average revenue per customer reaches £3,728.93 on two-year contracts versus just £1,369.25 on month-to-month — despite month-to-month generating the highest total revenue through sheer customer volume.
07
Lifetime Value
Churned Two-Year Customers Carried 5× the LTV of Churned M2M Customers
Estimated LTV for churned two-year customers is £5,316.90, versus £1,023.51 for churned month-to-month customers — contract commitment is the strongest predictor of customer value retained.
08
Risk Pillar
Where the Business Is Structurally Exposed
Contract Concentration
Month-to-Month Customers Generate 56.41% of Monthly Revenue
Month-to-month customers make up 55.02% of the customer base but 56.41% of monthly revenue — meaning over half of recurring revenue depends on the segment most likely to churn.
09
Service Concentration
Fiber Optic Represents the Largest Single Concentration Risk
Fiber optic contributes 62.11% of monthly revenue while also recording the highest churn rate (41.89%) of any internet service — high dependency and high attrition in the same category.
10
Predictive Risk
814 High-Risk Customers Identified Before They Churn
Customers on month-to-month contracts, paying >£70/month, with <12 months tenure, churn at 69.53% — more than 3× the standard customer base rate (20.92%) — and can be flagged proactively.
11
Structural Flag
The business's two largest revenue sources — month-to-month contracts and fiber optic service — are also its two highest-churn segments. This concentration means retention initiatives targeted at these two groups carry disproportionate revenue protection value relative to broader, undifferentiated retention spend.
Business Recommendations
Where Retention Investment Should Go
01
Onboarding
Improve Early Customer Retention
With 47.44% of churn occurring within the first 12 months, structured onboarding programmes, first-year engagement campaigns, and early satisfaction surveys represent the highest-leverage intervention window in the customer lifecycle.
02
Contract Strategy
Encourage Long-Term Contract Adoption
Month-to-month churn (42.71%) is 15× that of two-year contracts. Discounted annual plans, contract upgrade incentives, and renewal promotions could shift customers toward materially lower-churn, higher-LTV agreements.
03
Service Quality
Investigate the Fiber Optic Customer Experience
Fiber optic generates 62.11% of revenue while recording the highest churn rate in the dataset. A targeted review of service quality, pricing competitiveness, and support interactions is warranted given the scale of revenue dependency.
04
Value Protection
Target High-Value Customers Before Churn
Churned customers pay £13 more per month on average than retained customers. Retention campaigns should prioritise premium, long-tenure, and rising-spend customers — the segments with the greatest revenue at stake per account.
05
Predictive Retention
Deploy Predictive Retention Programmes
The 814-customer high-risk profile (M2M · >£70/mo · <12mo tenure, 69.53% churn) demonstrates that at-risk customers can be identified using observable characteristics — enabling risk scoring, automated workflows, and early intervention ahead of churn.
Methodology
10-Phase End-to-End Workflow
Phase 0
Environment Setup
Prepared the MySQL environment, imported the dataset, validated data integrity, and cleaned missing values.
Phase 1
SQL Extraction & Analysis
22 analytical queries answering customer, revenue, and risk business questions — CTEs, window functions, RANK, LAG, PERCENT_RANK.
Phase 2
Excel Import & Validation
Imported 17 SQL outputs into Excel, validated all datasets, and organised the workbook using structured tables.
Phase 3
KPI Framework Design
Designed a 10-metric executive KPI framework spanning Customer, Revenue, and Risk pillars.
Phase 4–6
Analytical Layers
Built Customer, Revenue, and Risk analytical layers — churn drivers, revenue exposure, LTV, and concentration risk.
Phase 7
Dashboard Design
Designed and documented four executive dashboards using a consistent navy/gold visual framework.
Phase 8
Business Insights
Converted analytical findings into business insights and five actionable strategic recommendations.
Phase 9–10
Documentation & Polish
Produced full project documentation, performed final QA, and exported dashboard assets for publication.
Full Project Repository
Telco Customer Churn Analysis — GitHub
Repository contains 6 SQL files (22 queries), 17 exported CSV datasets, the complete Excel workbook with four executive dashboards, and full phase-by-phase documentation.
View Repository →