Performance Snapshot
Key Metrics at a Glance
Total Revenue
£3.86M
2010 — 2011
Total Customers
2,997
unique customers
Total Transactions
166K
cleaned records
Avg Retention Rate
21.27%
excl. Jan 2011 anomaly
Revenue Volatility
78.60%
coefficient of variation
UK Revenue Share
84.42%
of total revenue
Executive Dashboard
Built in Microsoft Excel
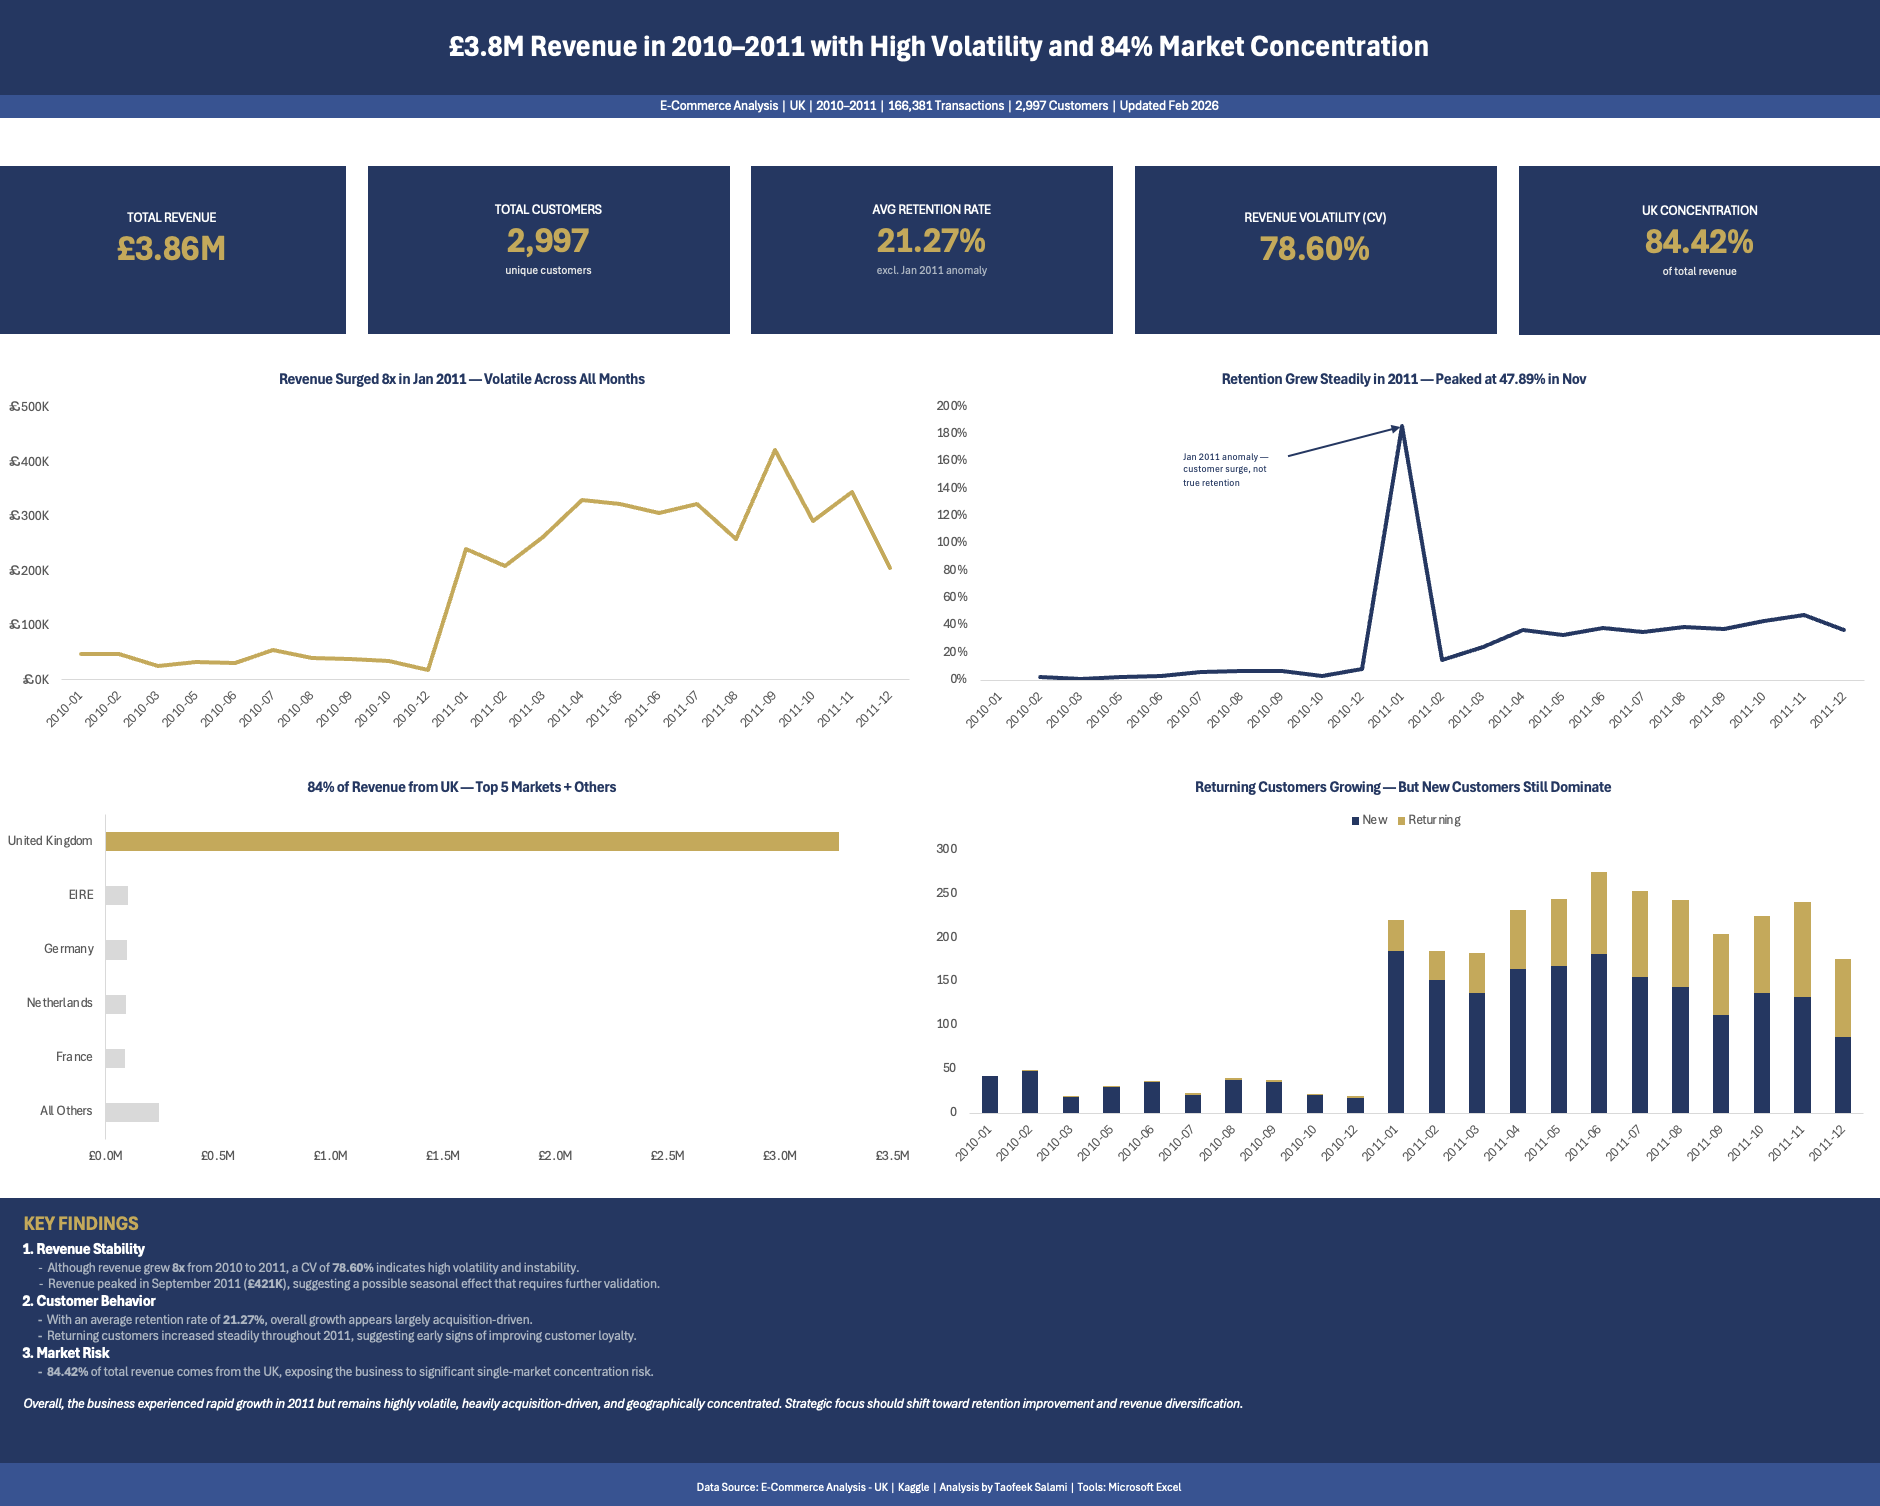
Full executive dashboard — Dark Navy & Gold color system — built entirely in Microsoft Excel
Analysis
What the Data Reveals
Revenue Growth
8x Year-Over-Year Growth — But Highly Unstable
Revenue grew from an average of £36K/month in 2010 to £292K/month in 2011. A CV of 78.60% confirms the growth was volatile, with monthly revenue swinging between £17K and £421K.
01
Customer Retention
21.27% Avg Retention — Growth is Acquisition-Driven
The implied churn rate of ~78.73% suggests most customers did not return after their initial purchase. Retention improved from below 10% in early 2010 to a peak of 47.89% in November 2011.
02
Customer Behaviour
Returning Customers Grew 40–50x Through 2011
Returning customers grew from 1–3 per month in early 2010 to 88–108 per month by late 2011, representing approximately 45% of active customers by November 2011 — early signs of loyalty development.
03
Market Concentration
84.42% of Revenue from UK — Extreme Concentration Risk
The second-largest market, EIRE, contributes only 2.52%. No country falls in the medium range — concentration jumps directly from 84.42% (UK) to 2.52% (EIRE). Extreme single-market dependency confirmed.
04
Data Anomaly
January 2011 — 186.29% Retention Rate Excluded
Active customers surged from 19 in December 2010 to 221 in January 2011 — a 1,000%+ increase. This mathematical impossibility was excluded from all retention calculations to preserve analytical accuracy.
05
Business Insights
Structured Analytical Insights
01
Revenue Stability
Revenue Grew 8x but CV of 78.60% Signals Instability
Revenue grew approximately 8x from 2010 to 2011, increasing from an average of £36K per month to £292K. However, a coefficient of variation of 78.60% indicates substantial instability, with monthly revenue fluctuating between £17K and £421K. Such volatility limits forecasting reliability and increases exposure to cash flow risk despite strong headline growth. The September 2011 peak of £421K suggests a potential seasonal effect which, if validated over multiple years, could inform inventory planning and marketing allocation around predictable high-demand periods.
02
Customer Retention
21.27% Average Retention — Largely Acquisition-Driven
With an average retention rate of 21.27%, revenue growth appears largely acquisition-driven rather than loyalty-based. The implied churn rate of approximately 78.73% suggests that most customers did not return after their initial purchase. However, retention improved significantly throughout 2011, rising from below 10% in early months to a peak of 47.89% in November, indicating early signs of strengthening customer loyalty.
03
Customer Behaviour
Returning Customers Grew 40–50x — Loyalty Base Emerging
New customers dominated monthly activity throughout the dataset, reinforcing an acquisition-led growth model. However, returning customers increased substantially from 1–3 per month in early 2010 to 88–108 per month by late 2011, accounting for approximately 45% of active customers by November 2011. This upward trajectory indicates early progress toward a more stable loyalty base.
04
Market Risk
84.42% UK Dependency — Extreme Concentration Exposure
The United Kingdom accounts for 84.42% of total revenue and 90.52% of customers, indicating significant single-market concentration. The second-largest market, EIRE, contributes only 2.52%, highlighting the absence of meaningful geographic diversification. Such dependency exposes the business to substantial systemic risk from regulatory changes, economic downturns, or competitive pressures within the UK.
05
Data Anomaly
January 2011 Anomaly — 186.29% Retention Excluded
January 2011 recorded an apparent retention rate of 186.29%, a mathematical impossibility under normal customer behaviour assumptions. This distortion was driven by a sharp increase in active customers from 19 in December 2010 to 221 in January 2011, representing an increase of over 1,000%. To preserve analytical accuracy, this outlier was excluded from average retention calculations, resulting in a more representative average of 21.27% across the remaining 21 months.
Recommendations
Strategic Actions
1
Prioritise Retention Infrastructure Investment
Implement structured post-purchase follow-ups, loyalty programmes, and personalised re-engagement campaigns to convert first-time buyers into repeat customers. Strengthening retention reduces reliance on continuous acquisition and improves revenue predictability.
2
Validate Seasonality Patterns
Investigate the September 2011 £421K revenue peak to determine whether it reflects recurring seasonality, promotional activity, or one-off external factors. If repeatable patterns are confirmed, align inventory planning and marketing allocation accordingly.
3
Consolidate Retention Momentum
Returning customers accounted for approximately 45% of active customers by November 2011. This upward trajectory should be reinforced through deliberate loyalty investment before growth normalises or reverses.
4
Gradually Diversify Geographic Exposure
Increase strategic focus on existing secondary markets such as Germany, the Netherlands, and France, which collectively contribute approximately 7% of revenue. Controlled expansion within known markets offers a lower-risk pathway toward diversification.
5
Strengthen Reporting Governance
Implement automated anomaly detection and validation checks within reporting workflows to prevent metric distortion, ensuring that strategic decisions are based on reliable data.
Methodology
10-Phase Analytical Workflow
Phase 1
Data Import
Imported CSV via Power Query. Set data types manually, renamed columns for consistency, added Year, Month, YearMonth and Revenue calculated columns.
Phase 2
Data Cleaning
Removed 5,269 duplicates, deleted null Customer IDs and Invoice Dates, removed 4,111 return rows. Added First_Purchase_Date and Customer_Type columns. Final: 166,381 rows.
Phase 3
KPI Design
Defined 10 core KPIs across Customer, Revenue and Risk pillars. Built PT_Active_Customers, PT_New_vs_Returning and PT_Monthly_Revenue PivotTables.
Phase 4
Retention Calculation
Built tbl_Retention with month-over-month retention and churn rates. Calculated avg retention of 21.27% using AVERAGEIF to exclude the Jan 2011 anomaly.
Phase 5
Revenue Stability
Built tbl_Revenue_Stability with growth %, cumulative revenue and revenue per customer type. CV = 78.60%. 2011 avg revenue 8x higher than 2010.
Phase 6
Segment Risk Analysis
Built tbl_Segment_Risk segmenting revenue and customers by country. Applied High/Medium/Low risk flags. UK flagged High at 84.42% revenue concentration.
Phase 7
Dashboard
Built executive dashboard with 5 KPI cards, 4 charts (revenue line, retention line, country bar, new vs returning stacked column), summary insight box and footer.
Phase 8
Insight Writing
Wrote 5 structured business insights covering revenue growth, retention, customer behaviour, market concentration and the January 2011 anomaly.
Phase 9
README
Wrote full project README covering executive summary, performance snapshot, business questions, key findings, implications, recommendations and strategic outlook.
Phase 10
Polish & Export
Polished dashboard, removed gridlines, hid working sheets, set Dashboard as active sheet. Exported screenshots. Uploaded to GitHub with Google Drive link for Excel file.
Analytical Note
Rev_Per_New_Customer and Rev_Per_Returning_Customer were calculated by dividing total monthly revenue by the respective customer count. This method does not isolate revenue generated by each customer type at transaction level and should be interpreted with caution. A more accurate segmentation would require tagging individual transactions by Customer_Type and summing revenue separately.