Performance Snapshot
Key Metrics at a Glance
Total Borrowers
149,999
after Phase 1 cleaning
Overall Default Rate
6.68%
baseline for all segment comparisons
Critical Risk Default Rate
47.11%
vs. 2.23% for Low tier
Strongest Risk Signal
54.65%
placeholder delinquency codes 96/98
Peak Combined Risk
55.0%
Critical risk × Critical exposure
Zero Credit Lines Default
25.64%
highest of any credit-line band
Interactive Dashboards
Four Dashboards, One Compounding Risk Story
Built in Tableau Public using a consistent navy/gold visual system — SQL and Python compute every score in advance, Tableau presents and lets the viewer filter and explore. Each dashboard moves from "what is the portfolio's risk position?" to "where specifically should underwriting act?"
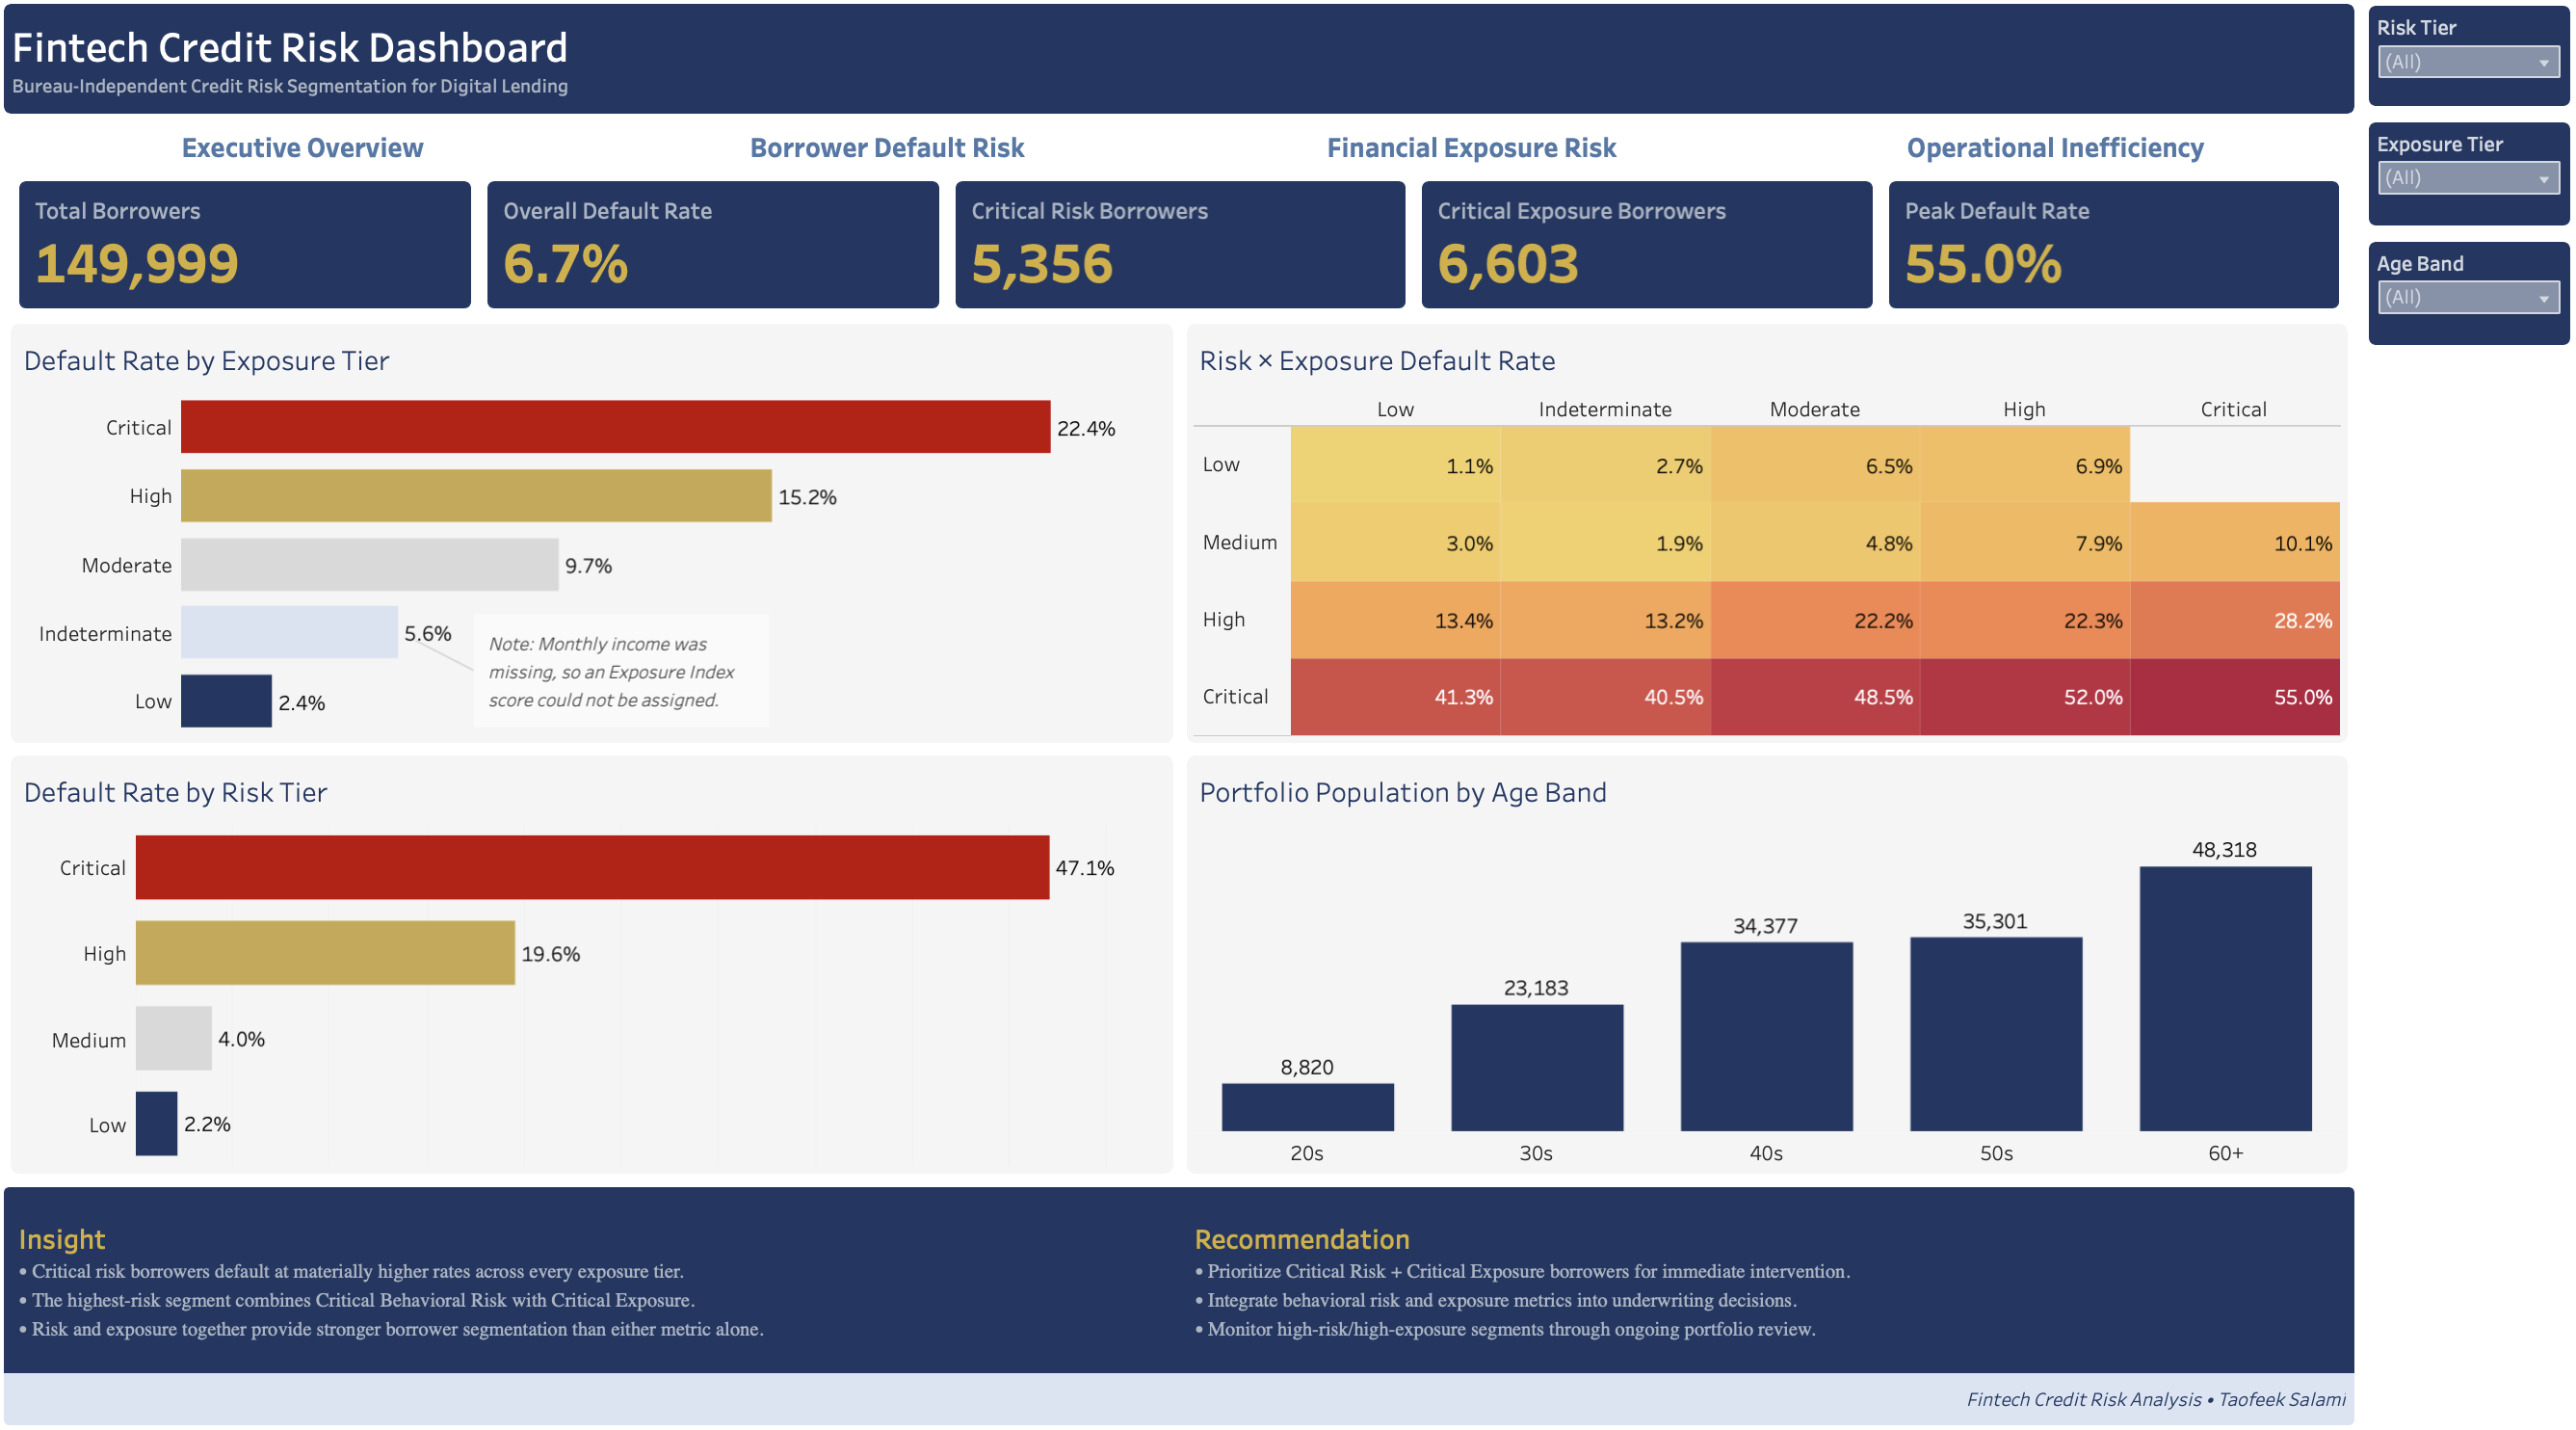
01 — Executive Overview: portfolio KPIs and the Risk × Exposure compounding heatmap
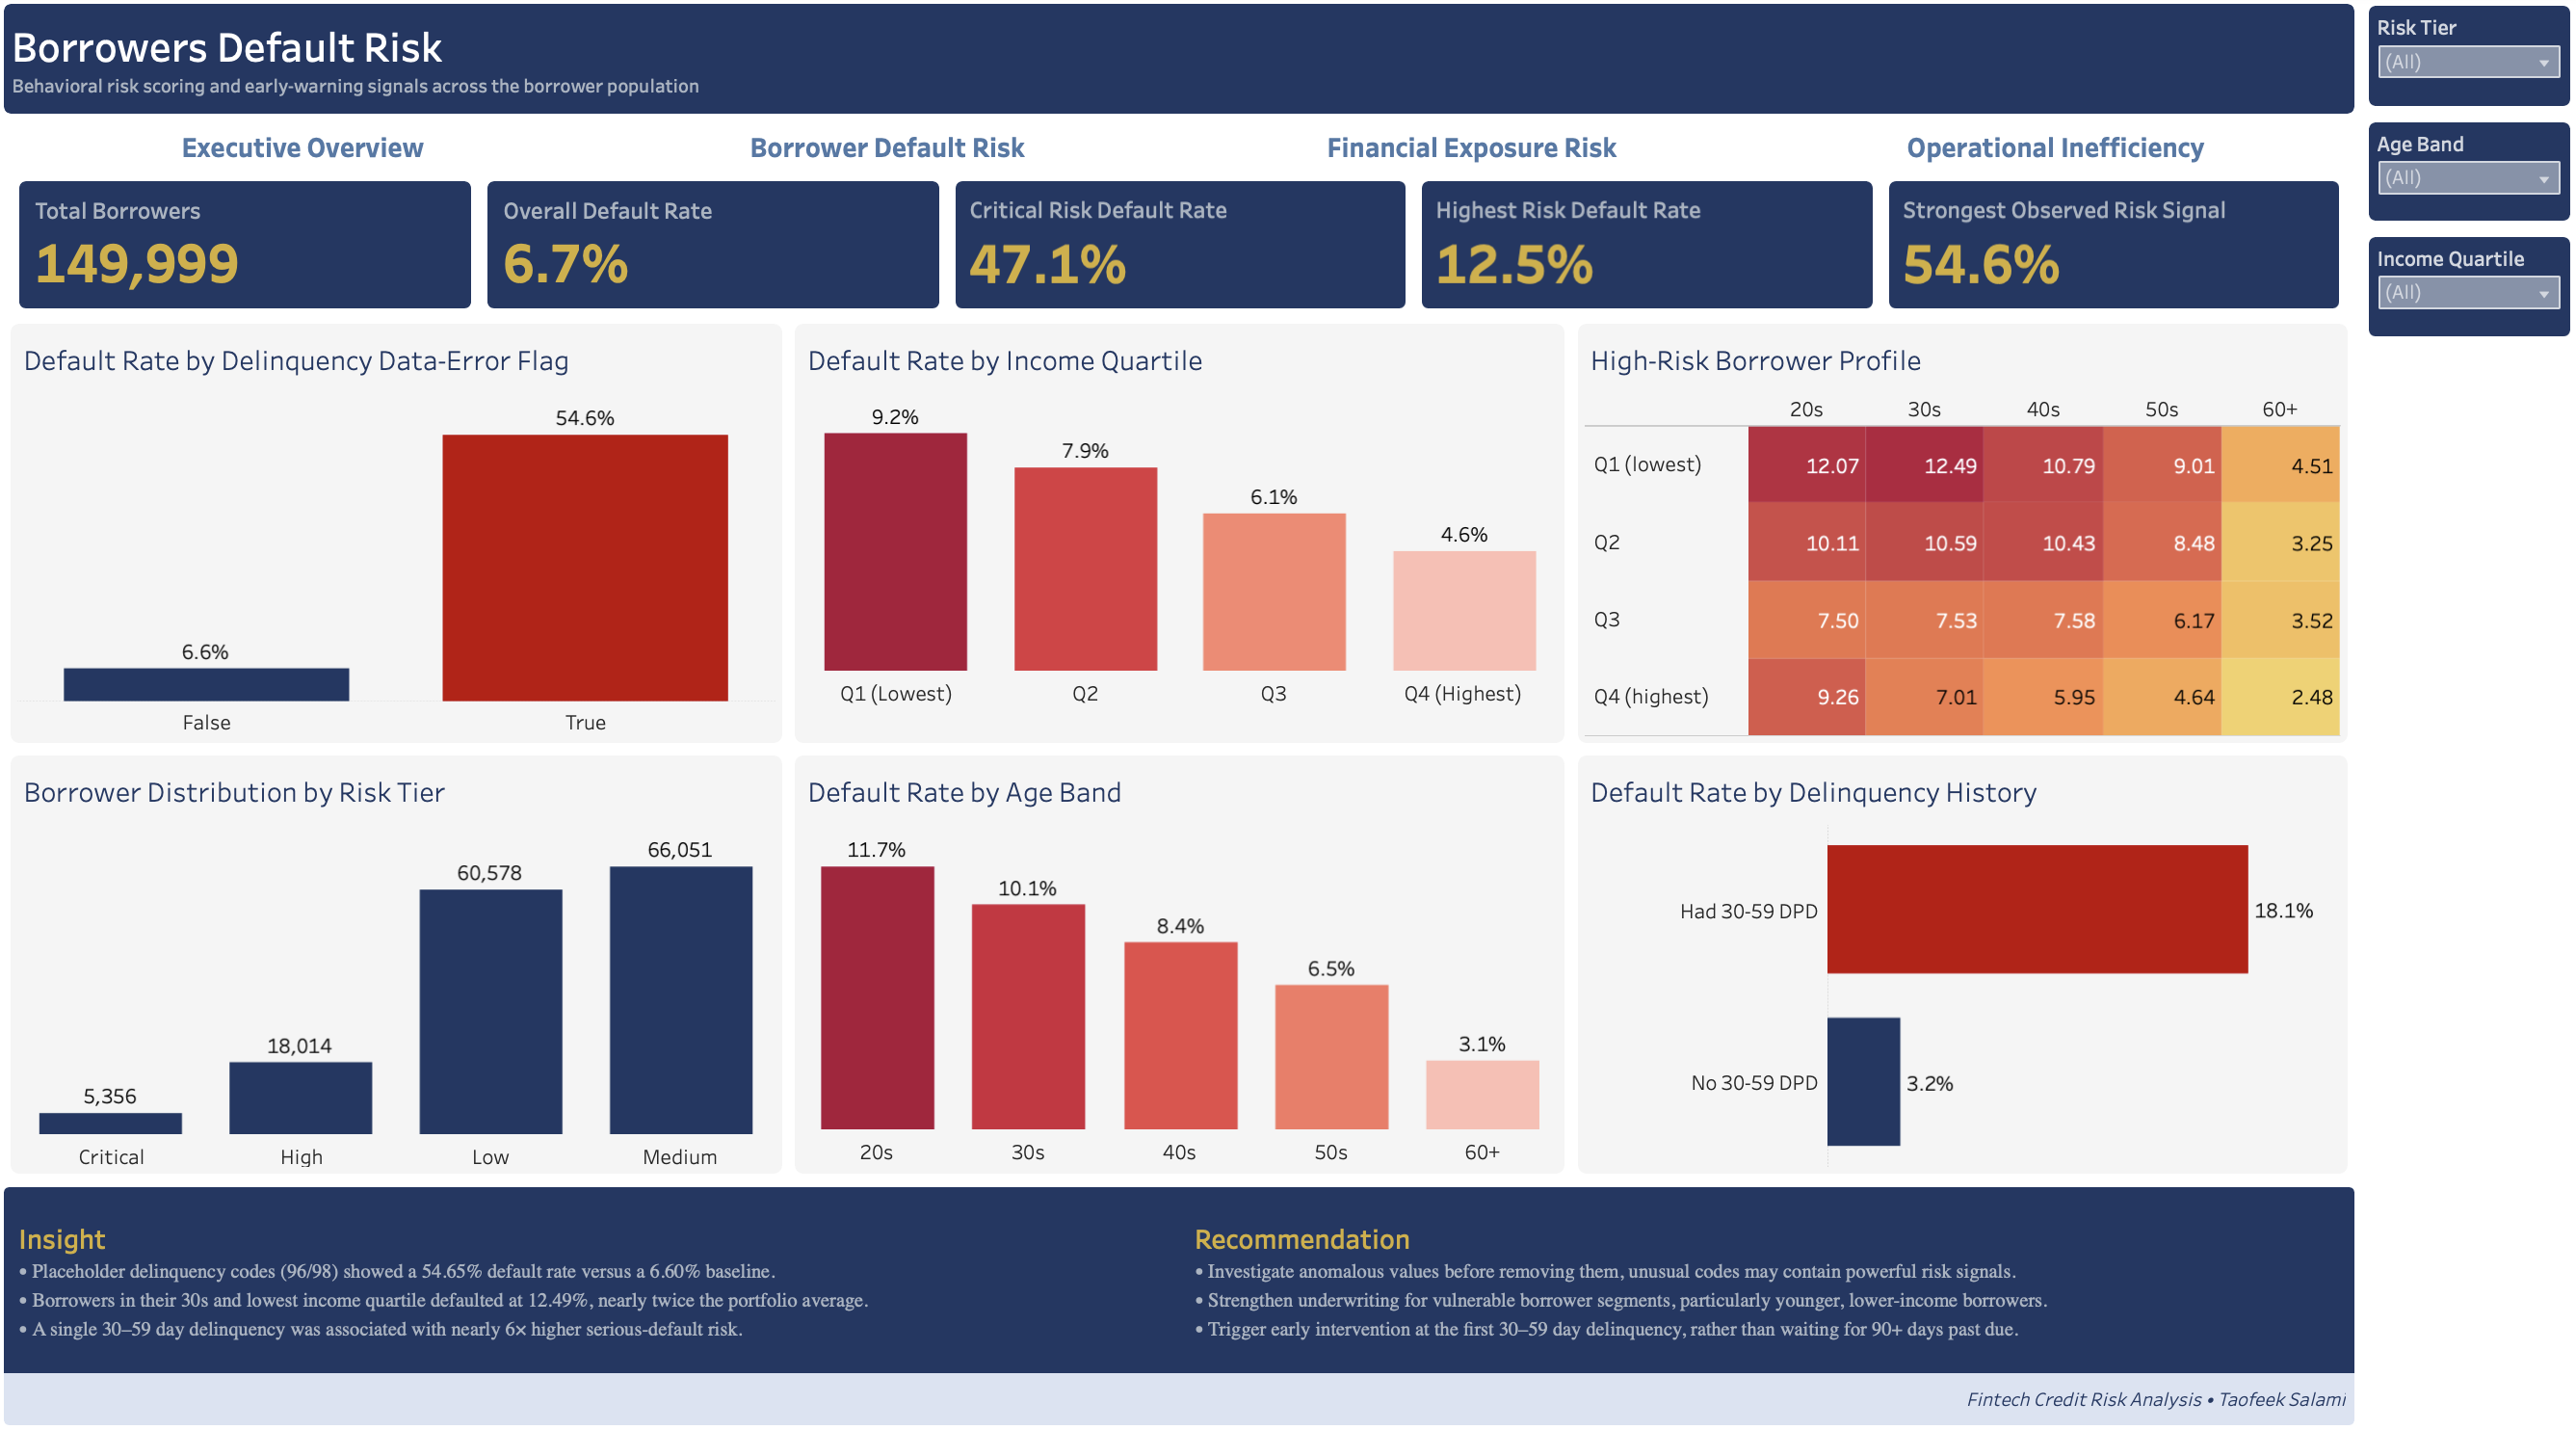
02 — Borrower Default Risk: behavioral risk tiers, age/income segmentation, and early-warning signals
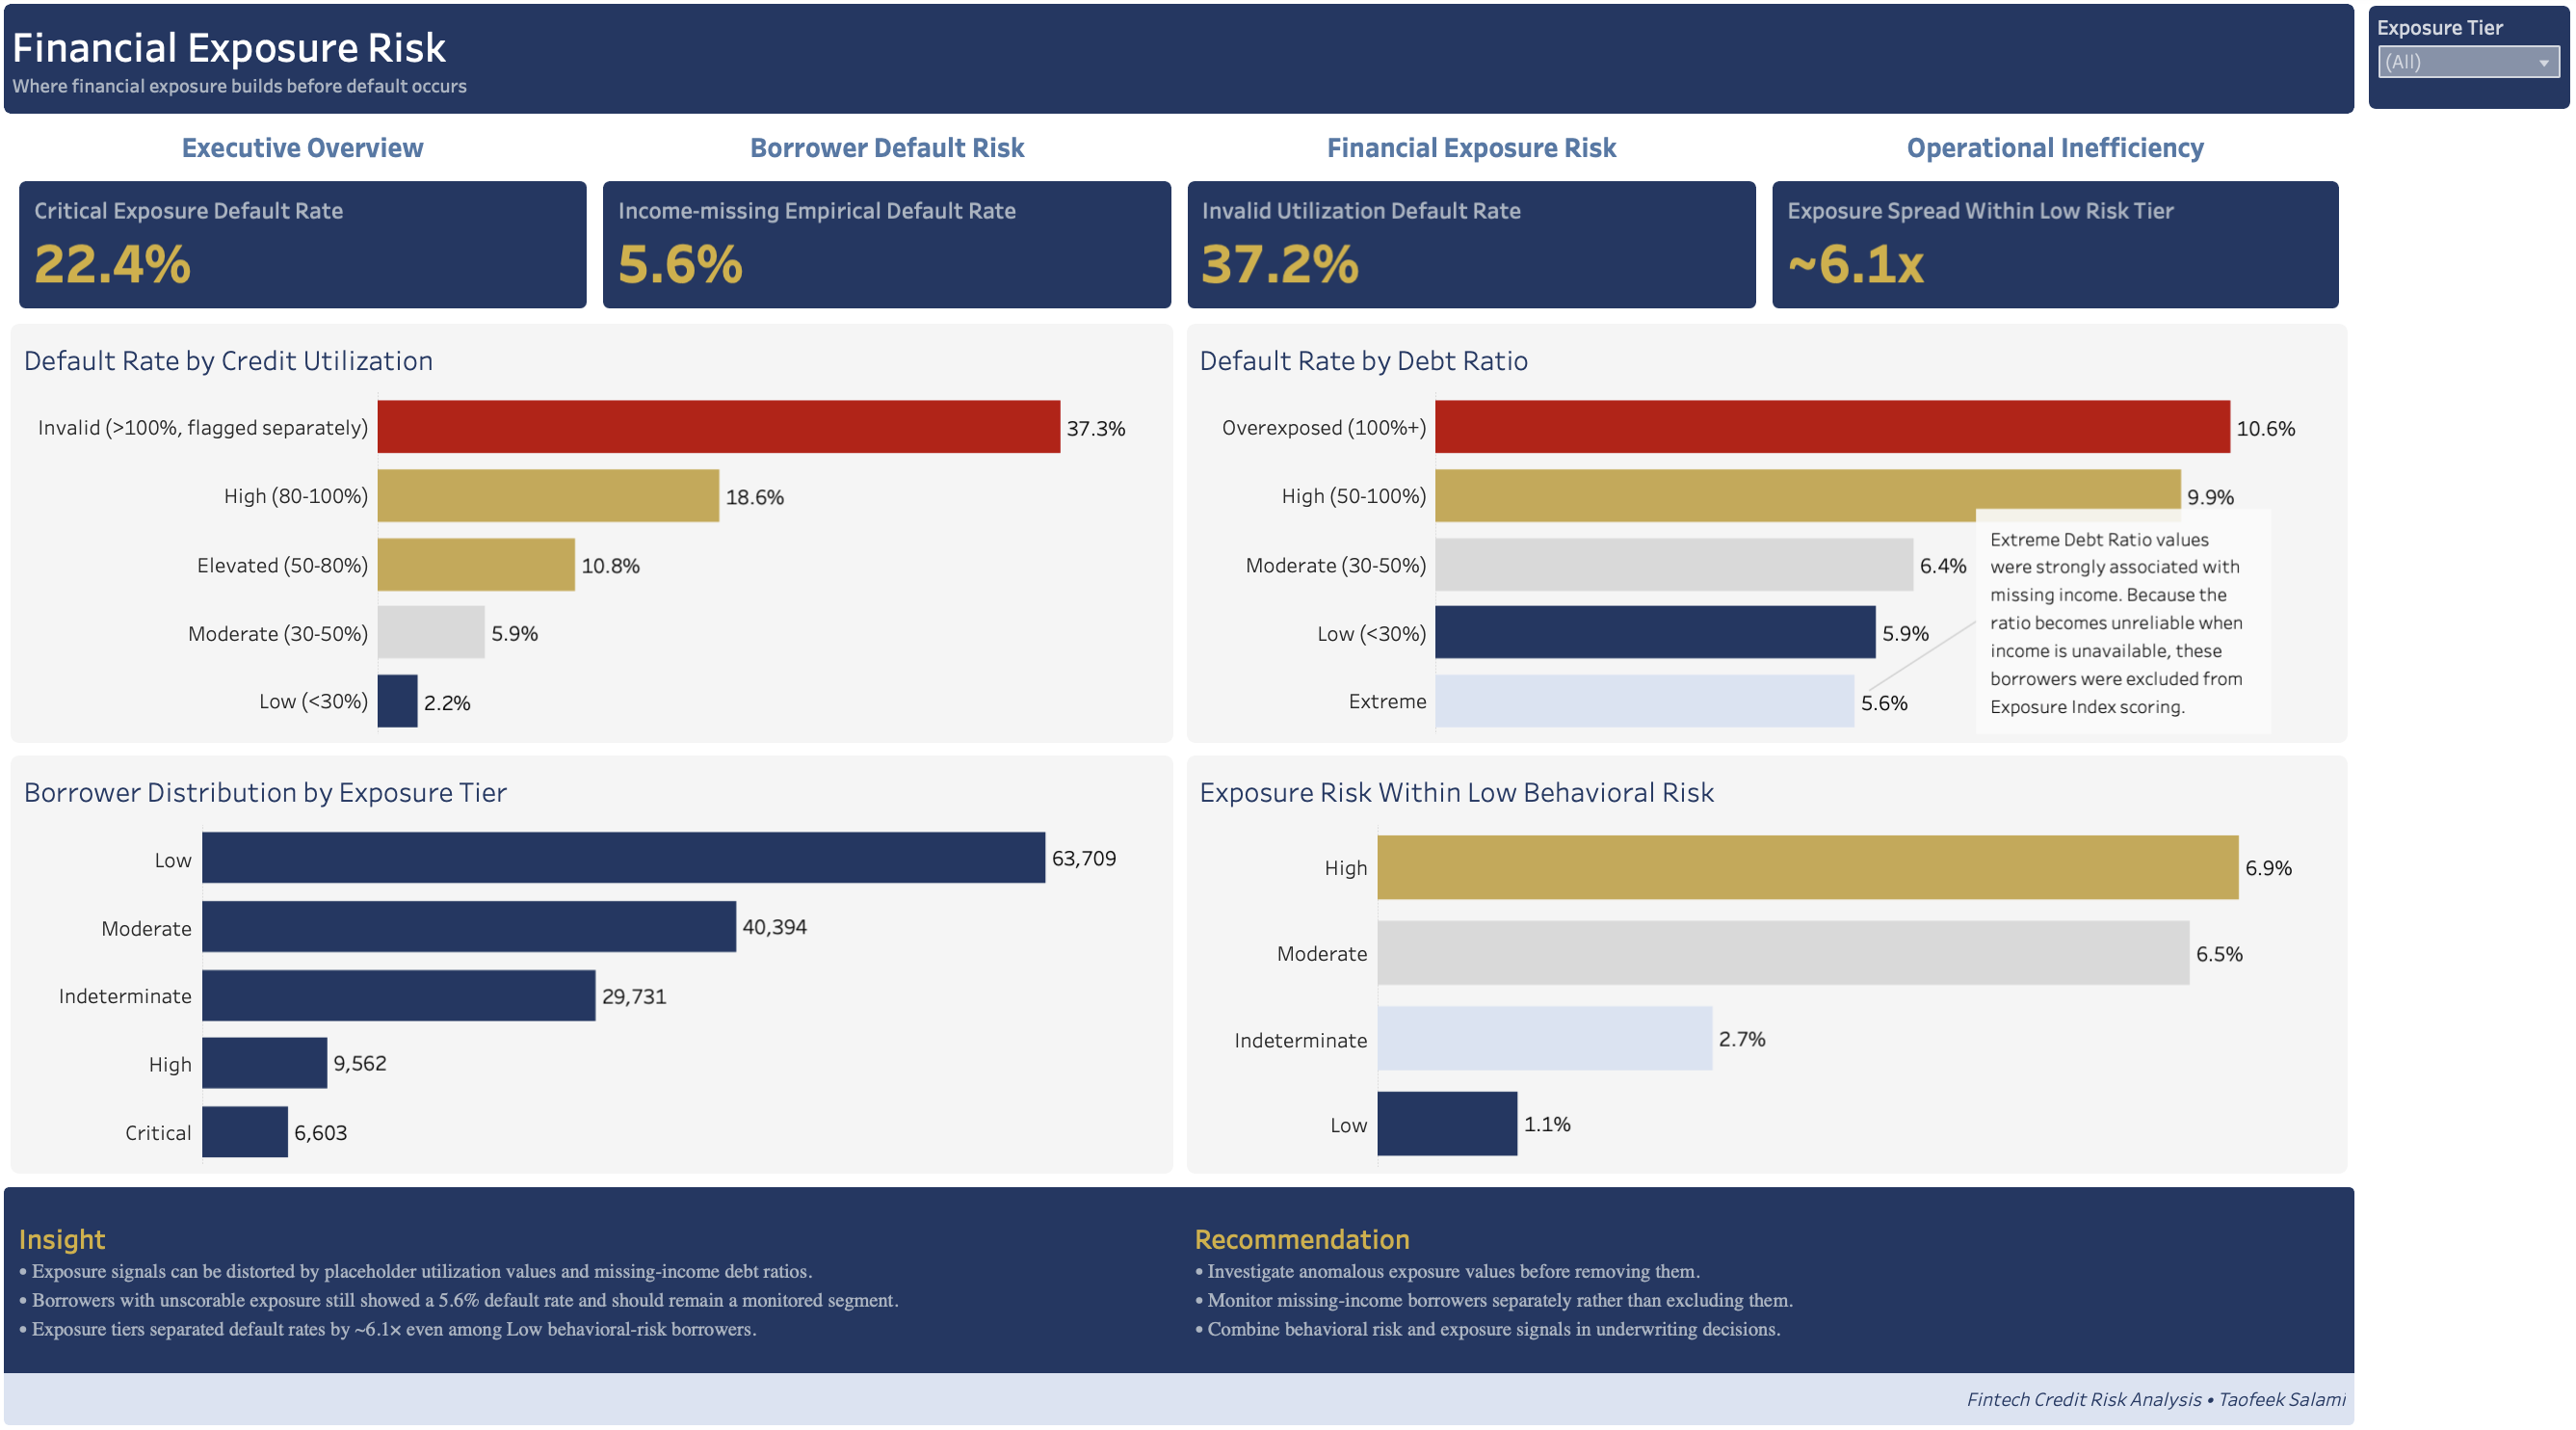
03 — Financial Exposure Risk: Exposure Index, utilization and debt ratio bands, data-quality corrections
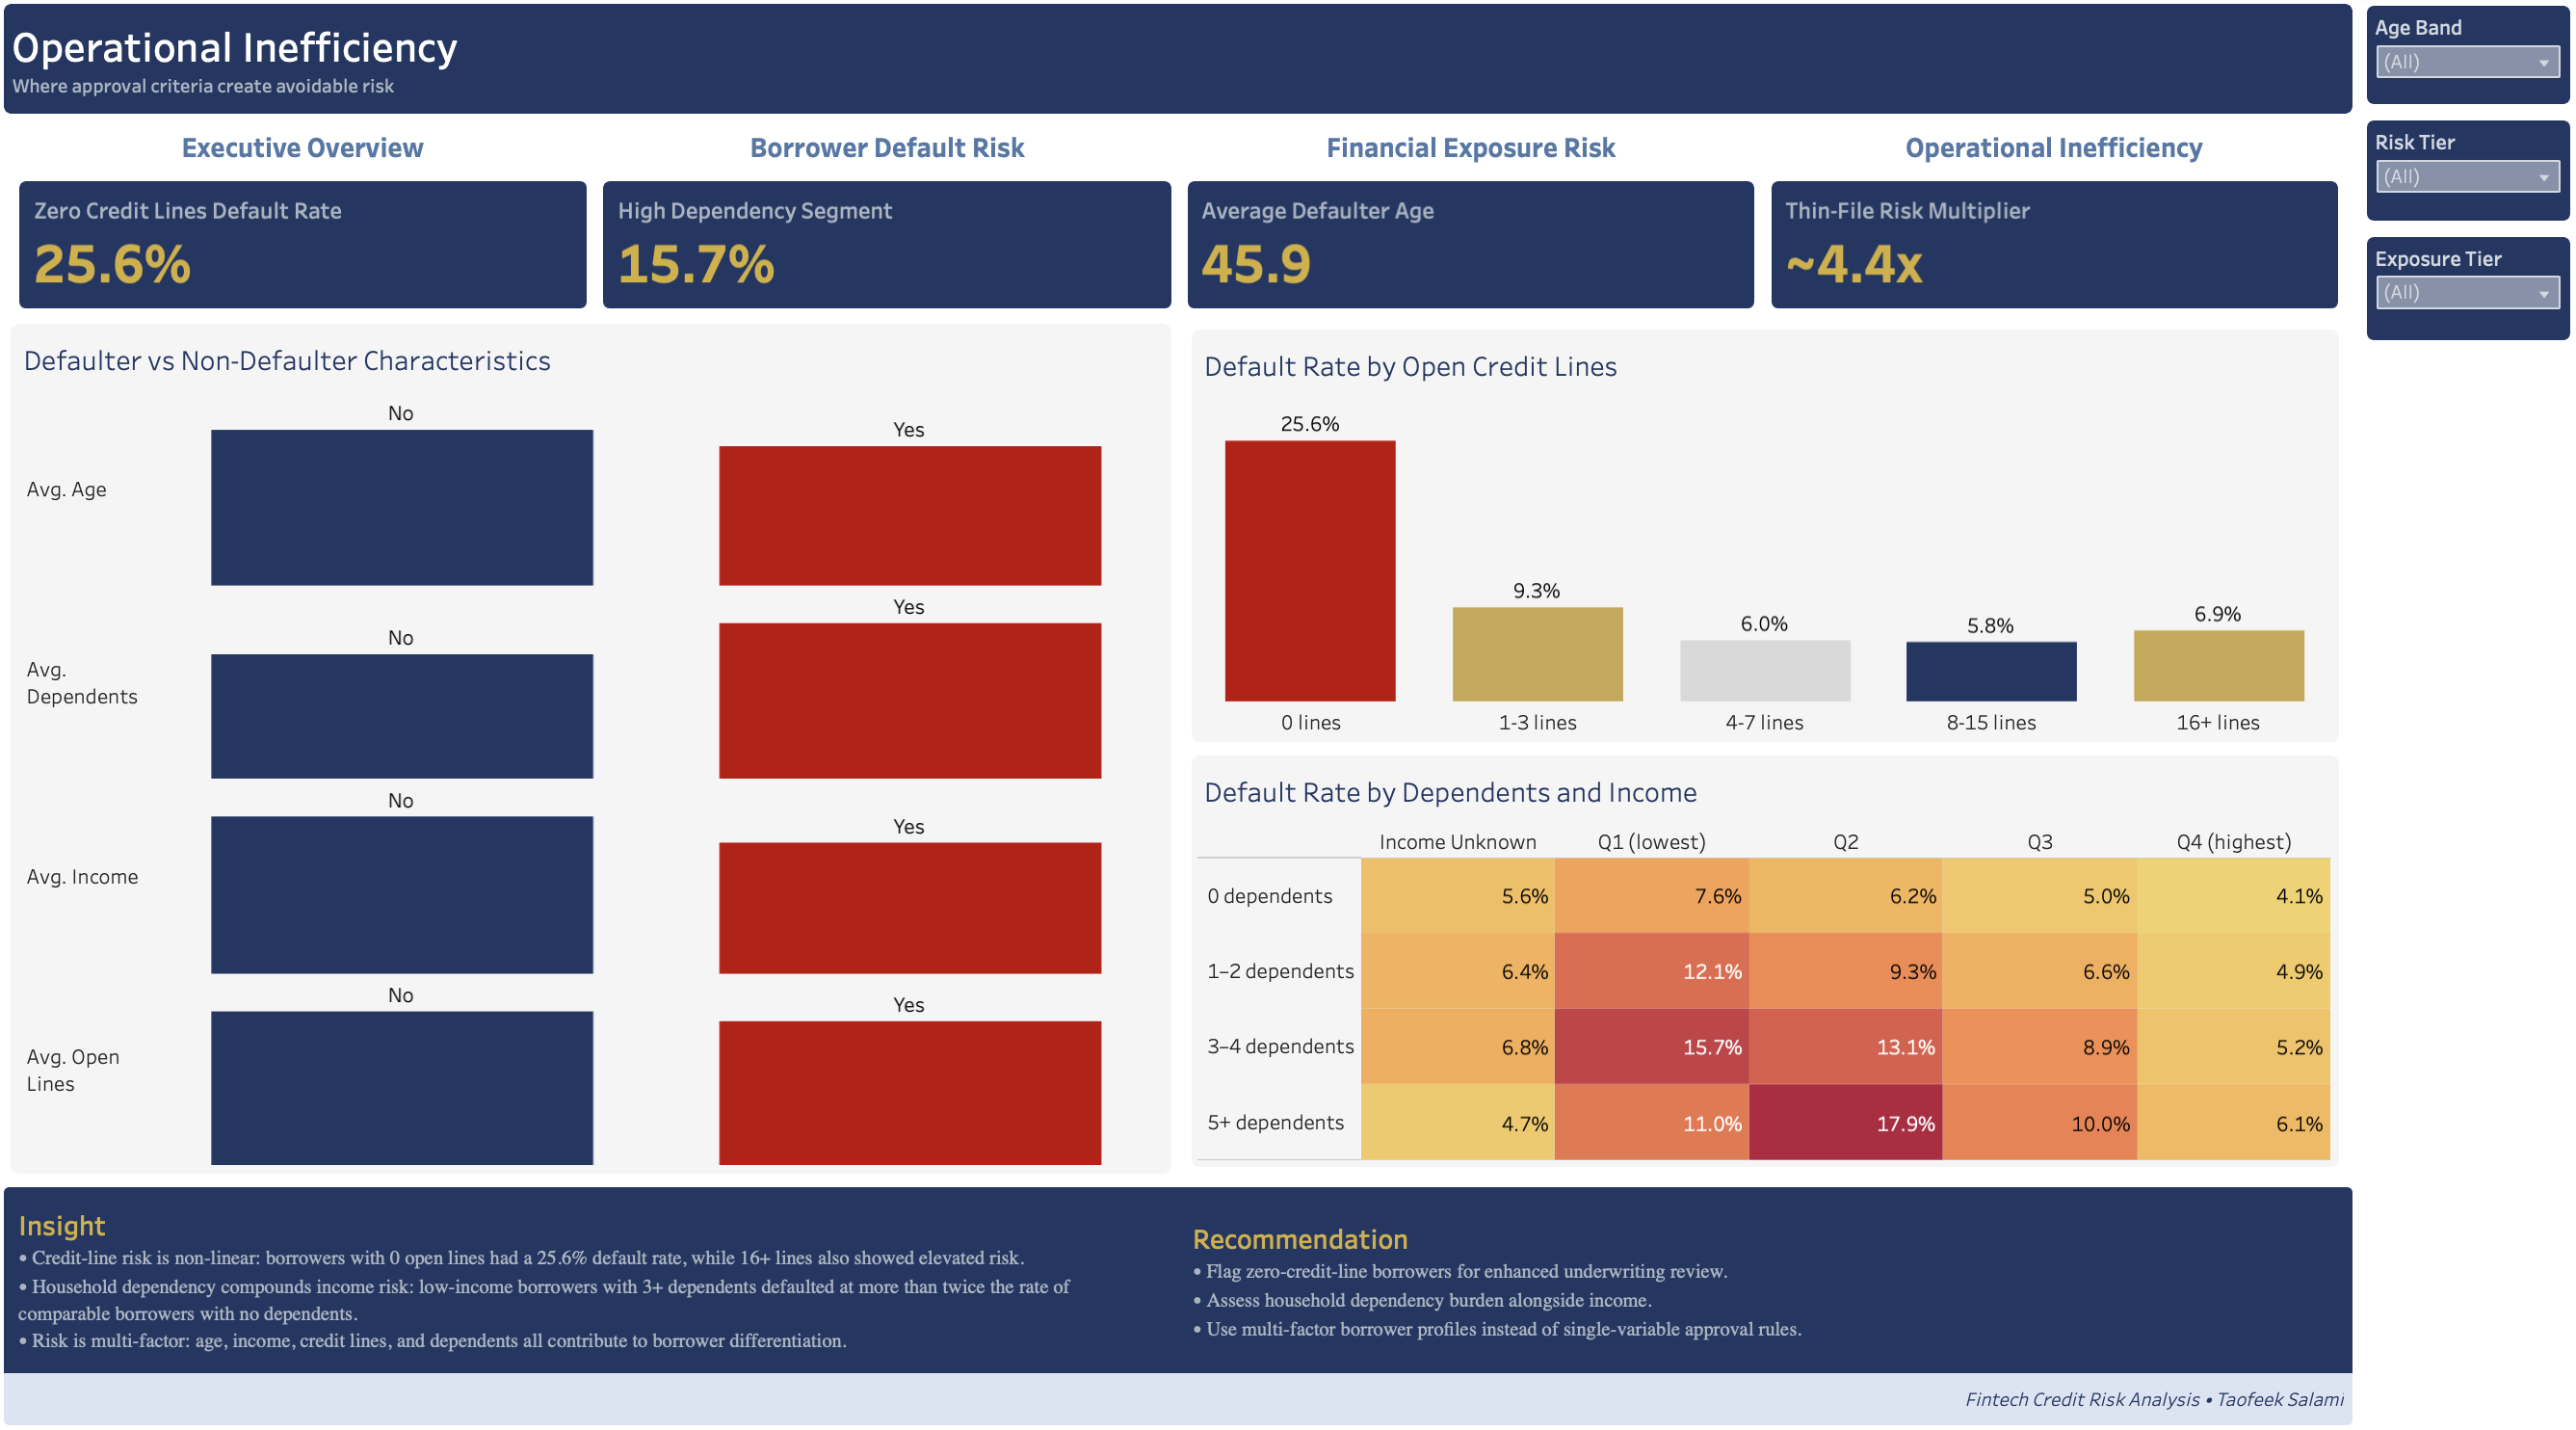
04 — Operational Inefficiency: credit-line proliferation, dependency burden, and approval-criteria gaps
Borrower Default Risk
Who Is Defaulting, and the Earliest Signals
Data Quality Signal
A Placeholder Data-Error Code Was the Strongest Risk Signal Found
269 borrowers carrying placeholder delinquency codes (96/98) — clearly not genuine payment counts — recorded a 54.65% observed default rate, versus 6.60% for the rest of the population. Investigated rather than discarded, it became the single strongest observed risk signal in the dataset.
01
Age & Income
Borrowers in Their 30s on Lowest Income Default at 12.49%
Borrowers aged 30–39 in the lowest income quartile recorded a 12.49% default rate (n=6,135) — nearly double the 6.68% portfolio baseline, and the highest of any age × income combination.
02
Early Warning
A Single Early Delinquency Corresponded With a 5.7× Higher Default Rate
Borrowers with a single 30–59 day delinquency recorded an 18.13% default rate, compared to 3.17% for those with none — an early, observable risk marker rather than waiting for 90+ day default.
03
Risk Segmentation
Behavioral Risk Tiers Showed a 21× Difference in Observed Default Rates
A custom Behavioral Risk Score, built from delinquency frequency, recency proxy, and severity. The score differentiated observed default rates across the four tiers; Low, Medium, High, and Critical tiers — with Critical borrowers defaulting at 47.11% against 2.23% for Low.
04
Financial Exposure Risk
Where Financial Exposure Is Associated With Higher Default Risk
Exposure Index
A Custom Exposure Index Revealed Additional Default-Rate Differences Beyond Payment History
Built from credit utilization and debt burden — since the dataset has no loan balance or credit-limit fields — the Exposure Index separated observed default rates by ~6.1×, even among borrowers with a clean behavioral risk record.
05
Data Quality
Two Measurement Limitations Were Identified and Corrected
Utilization defaulted to a placeholder value for borrowers with zero open credit lines, and debt ratio became unreliable when income was missing (90.04% overlap). Both were investigated and explicitly handled before being used in the index.
06
Missing Data
Missing Income Borrowers Preserved as a Monitored Segment
19.82% of borrowers could not be scored on the Exposure Index due to missing income. Rather than fabricating a score, they were labeled Indeterminate their empirical default rate of 5.61% fell between the observed default rates of the Low and Moderate tiers.
07
Combined Risk
Critical Risk + Critical Exposure Recorded a 55.0% Default Rate
Borrowers scoring Critical on both behavioral risk and financial exposure recorded a 55.0% observed default rate — the highest combined-risk segment identified and higher than the observed default rate associated with either dimension alone.
08
Operational Inefficiency
Where Approval Criteria Create Avoidable Risk
Thin-File Risk
Zero Open Credit Lines Recorded the Highest Default Rate of Any Band
Borrowers with zero open credit lines recorded a 25.64% default rate — higher than every other credit-line band, including the most credit-active borrowers (16+ lines, 6.9%). Observed default rates followed a U-shaped pattern rather than moving consistently in one direction with credit-line count.
09
Household Burden
Dependency Burden Was Associated With Higher Default Rates Among Lower-Income Borrowers
Borrowers with 3–4 dependents in the lowest income quartile recorded a 15.69% default rate — more than double the 7.6% rate of income-matched borrowers with no dependents.
10
Approval Calibration
Defaulters Differ Consistently Across Every Measured Characteristic
Defaulters averaged 45.9 years old versus 51.7 for non-defaulters, alongside observed differences in income, open credit lines, and dependents — suggesting that default risk is associated with multiple borrower characteristics rather than a single measured variable.
11
Structural Flag
The observed differences across all three pillars support evaluating a move away from single-variable approval rules — such as income alone or credit history alone — toward a multi-factor borrower assessment combining behavioral history, financial exposure, and structural characteristics such as credit-line count and dependency burden.
Business Recommendations
Where Underwriting Investment Should Go
01
Data Quality
Investigate Anomalous Values Before Removing Them
Unusual or placeholder codes may contain the strongest available risk signal, as demonstrated by the 54.65% default-rate finding. Automatic removal risks discarding potentially meaningful risk information.
02
Underwriting Model
Use Behavioral Risk and Financial Exposure Together in Underwriting Assessment
The two dimensions captured different aspects of borrower risk, and borrowers classified as Critical on both recorded the highest observed default rate at 55.0%. A multi-dimensional underwriting assessment could therefore provide more complete risk context than relying on either dimension alone, subject to further validation before production use.
03
Thin-File Applicants
Flag Zero-Credit-Line Applicants for Enhanced Review
This segment recorded the highest observed default rate of any credit-line band (25.64%) — thin-file applicants should not automatically be treated as neutral or low-risk.
04
Household Assessment
Weight Dependency Burden Alongside Income
Borrowers with 3+ dependents in the lowest income quartile default at more than twice the rate of income-matched peers with no dependents — a borrower characteristic that may be overlooked in income-only assessment.
05
Early Intervention
Trigger Outreach at the First 30–59 Day Delinquency
A single early delinquency was associated with an approximately 5.7× higher observed default rate compared with borrowers with no 30–59 day delinquency — supporting earlier review before borrowers reach 90+ day delinquency.
Methodology
7-Phase End-to-End Workflow
Phase 0
Setup & Database Design
Prepared the MySQL environment, ingested the Kaggle dataset via Python/SQLAlchemy ETL, resolved a schema precision issue caused by extreme utilization outliers.
Phase 1
Cleaning & Exploratory Analysis
Five documented cleaning decisions — age=0 removal, income-missing flagging (not imputed), dependents imputation, utilization-extreme flagging, and delinquency placeholder-code discovery.
Phase 2
Borrower Default Risk
SQL segmentation by age and income, high-risk borrower profiling, delinquency progression analysis, and a Python-built Behavioral Risk Score whose tiers were compared against observed default rates.
Phase 3
Financial Exposure Risk
Built a custom Exposure Index from utilization and debt ratio, identified and corrected two data-quality limitations, ...examined observed default-rate differences within the Low behavioral-risk tier, including an approximately 6.1× spread across exposure categories.
Phase 4
Operational Inefficiency
Analysed credit-line proliferation, dependency burden versus income, and structural differences between defaulters and non-defaulters across every measured characteristic.
Phase 5
Dashboard Design
Designed and built four interactive Tableau dashboards using a consistent navy/gold visual system, custom tooltips, mark annotations, and verified global filter scope.
Phase 6
Business Insights
Converted analytical findings into evidence-calibrated business insights and recommendations, matching the strength of each claim to the strength of its underlying evidence.
Full Project Repository
Fintech Credit Risk Analysis — GitHub
Repository contains SQL scripts, Python notebooks covering ETL, risk scoring, and exposure indexing, the full Tableau workbook with four interactive dashboards, and complete phase-by-phase documentation including a data dictionary and project glossary.
View Repository →