Performance Snapshot
Key Metrics at a Glance
Fleet On-Time Rate
55.7%
vs. 95%+ industry benchmark
Total Maintenance Spend
$5.7M
across all tracked vehicles
Top Driver On-Time
58.8%
DRV00108 — fleet best
Best Route Margin
85.3%
RTE00044 — most profitable
Worst Route Margin
–609%
RTE00010 — urgent review
Highest Maint. Cost
$0.06/mi
TRK00040 — top burden
Interactive Dashboard
Built in Tableau Public
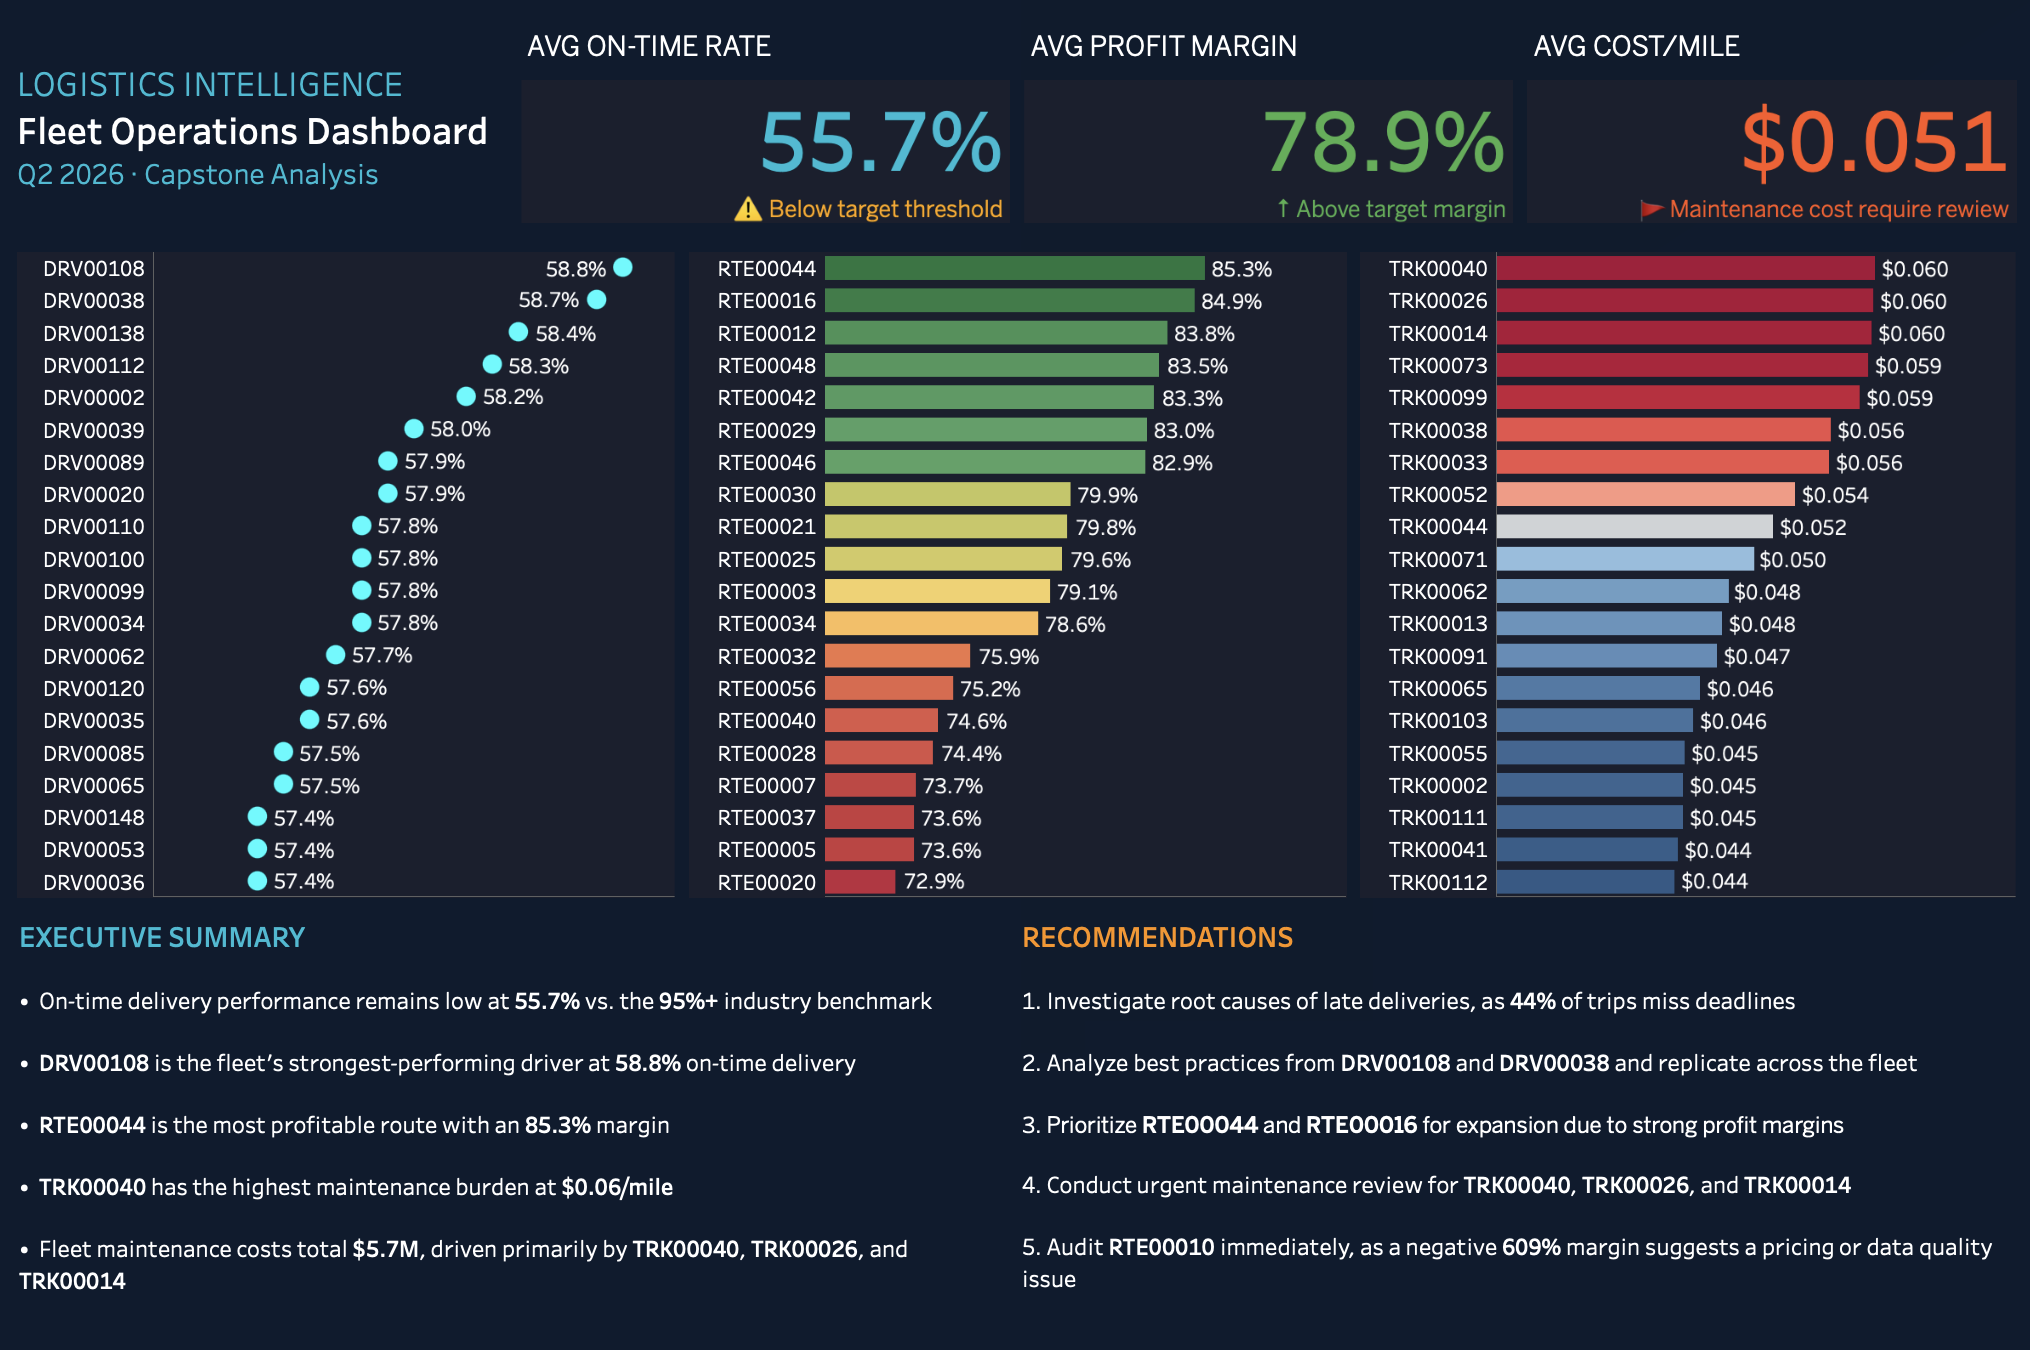
Fleet Operations Dashboard — Driver · Route · Fleet Health · Q2 2026 Capstone Analysis
Live Tableau Dashboard
Logistics Operations Dashboard
Interactive Tableau Public dashboard covering fleet on-time rate, driver ranking, route profitability, and maintenance cost per mile. Filterable by driver, route, and vehicle.
View Live Dashboard →
Capstone Project
This analysis served as the capstone submission for the TS Academy Data Analytics training programme — a 3-month structured course covering the full analytics workflow. The programme certification was issued in July 2026, following the completion of this project.
Analysis
What the Data Reveals
Fleet Performance
55.7% On-Time Rate — Systemic Delivery Failure
The fleet's average on-time delivery rate of 55.7% sits nearly 40 percentage points below the 95%+ industry benchmark. With 44% of trips missing deadlines, this is not an isolated driver issue — it signals a systemic operational problem requiring root cause investigation.
01
Driver Performance
DRV00108 Leads the Fleet at 58.8% — Still Below Benchmark
The fleet's top-performing driver, DRV00108, achieves a 58.8% on-time rate, closely followed by DRV00038 at 58.7%. Even the best performers sit well below industry standard, suggesting structural factors — routing, scheduling, or vehicle reliability — rather than individual capability are the primary constraint.
02
Route Profitability
RTE00044 Delivers 85.3% Margin — Top Expansion Candidate
RTE00044 is the most profitable route at 85.3% margin, followed by RTE00016 at 84.9% and RTE00012 at 83.8%. These routes represent the strongest candidates for volume expansion and should be used as benchmarks when optimising underperforming routes.
03
Route Risk
RTE00010 at –609% Margin — Pricing or Data Quality Issue
RTE00010 is operating at a –609% profit margin — a mathematically extreme result that warrants immediate investigation. This could indicate a pricing error, data entry fault, or a structurally unviable route absorbing disproportionate cost without revenue offset.
04
Fleet Health
TRK00040 Carries the Highest Maintenance Burden at $0.06/mile
TRK00040, TRK00026, and TRK00014 are the three highest-cost vehicles at $0.060/mile each. These vehicles collectively represent the top of a maintenance cost distribution that totals $5.7M across the fleet — a spend level that demands structured review and potential early retirement decisions.
05
Data Scope
14 Relational Tables · 85,000+ Trip Records Processed
The analysis pipeline ingested 14 relational tables covering trips, drivers, routes, vehicles, maintenance logs, and cost records. Null handling, foreign key validation, and data type correction were completed across three structured notebooks before analysis began.
06
Analytical Flag
RTE00010's –609% margin should be treated as unresolved until the underlying cause is confirmed. If this reflects a data entry error, the route's true performance may be acceptable. If it reflects real cost and revenue figures, the route requires immediate commercial review and potential suspension.
Business Insights
Structured Analytical Insights
01
Fleet Performance
44% of Trips Miss Deadlines — A Structural Problem, Not a Driver Problem
A 55.7% on-time rate against a 95%+ industry standard means nearly half of all trips are delivered late. Critically, even the best-performing driver in the fleet peaks at 58.8% — suggesting the ceiling on individual performance is constrained by factors outside driver control. Root cause investigation should prioritise routing efficiency, scheduling windows, and vehicle reliability before focusing on driver-level intervention.
02
Route Strategy
High-Margin Routes Warrant Expansion — RTE00010 Requires Immediate Audit
Routes RTE00044, RTE00016, and RTE00012 collectively deliver margins above 83%, representing the business's strongest commercial assets. These routes should receive priority resourcing — top drivers, well-maintained vehicles, and optimised scheduling. Simultaneously, RTE00010's –609% margin demands an immediate audit to determine whether the figure reflects a data fault or a genuinely loss-making operation.
03
Maintenance Risk
$5.7M Maintenance Spend Concentrated in Highest-Cost Vehicles
Total fleet maintenance spend of $5.7M is disproportionately concentrated in a small number of high-cost vehicles — TRK00040, TRK00026, and TRK00014 each reaching $0.060/mile. A structured review should assess whether the operational value of these vehicles justifies continued maintenance investment or whether early retirement and replacement would reduce total fleet cost.
04
Driver Development
Replicate Best Practices from DRV00108 and DRV00038 Across the Fleet
DRV00108 (58.8%) and DRV00038 (58.7%) represent the fleet's performance ceiling. Understanding what distinguishes these drivers — route familiarity, scheduling habits, vehicle preferences — and systematically applying those practices to lower-performing drivers offers a near-term lever for improving fleet-wide on-time delivery without infrastructure investment.
Methodology
3-Notebook Analytical Pipeline
Notebook 01
Data Exploration
Loaded all 14 tables from raw CSV files. Checked null distribution, verified foreign key relationships across tables, assessed data types and row counts.
Notebook 02
Data Cleaning
Fixed null values, converted data types, standardised categorical fields, and exported clean CSVs for analysis. All cleaning decisions documented inline.
Notebook 03
Analysis
Computed driver on-time rates, route profit margins, fleet maintenance cost per mile. Surfaced top and bottom performers across all three operational dimensions.
Tableau
Dashboard Build
Packaged analysis outputs into an interactive Tableau Public dashboard with driver ranking, route profitability, and fleet maintenance views.